About Geary's C
Geary’s C (Geary, 1954), also known as Geary’s Contiguity Ratio or the Geary index, along with Moran's I (Moran, 1948), are possibly the best known measures to test for spatial autocorrelation. Both methods follow the same structure in the Task Manager and can be found under Clustering from the Methods menu.
The local ci statistic decomposes the global Geary’s C into contributions for each location, i. With many observations and normalized spatial weights, the average local c will equal the global C. The sum of ci , for all observations is proportional to Geary’s C, an indicator of global pattern.
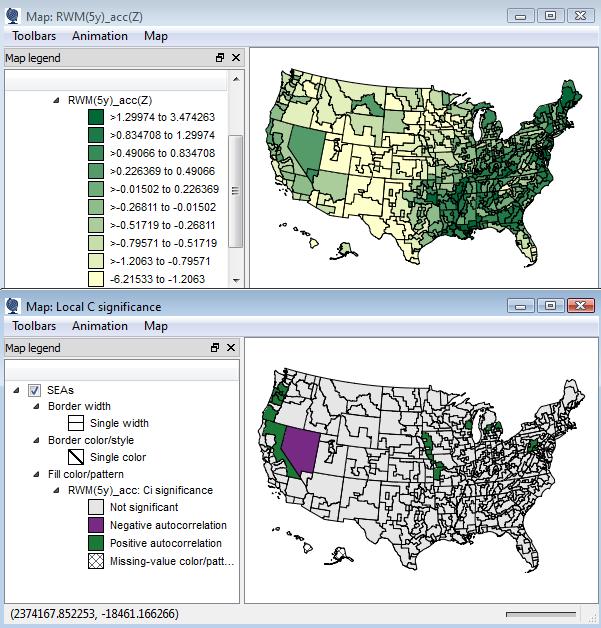
The screenshot below shows the standardization of the original data (top), and SpaceStat’s map output (bottom) of the results of a Geary’s C analysis on white male lung cancer rates. See Geary's C Results for information on how to interpret this information.