


p-values
P-values, short for probability values, provide an estimate of how unusual the observed values are. The p-value of a test statistic can be obtained by comparing the test statistic to its expected distribution under the null hypothesis (the null distribution).
The interpretation of a test statistic balances the possibility of two types of errors. Declaring whether a p-value is statistically significant involves choosing the level of error with which you are comfortable. Alpha provides the threshold for significance. If the p-value for the observed value falls below alpha, then the observation is termed significant.
|
concept |
symbol or formula |
meaning |
|
a, alpha (also called significance level) |
the probability of rejecting the null hypothesis when it is true |
|
|
b, beta |
the probability of accepting the null hypothesis when it is false |
|
|
1 - b |
the power of a test indicates its ability to reject the null hypothesis when it is false |
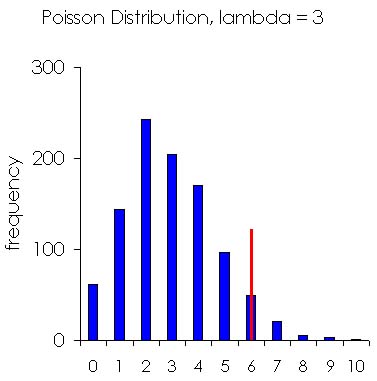
The value 0.05 is the traditional alpha level, which can be interpreted to mean that results that are more extreme would occur by chance less than 5% of the time, if the null hypothesis were true. The figure below graphs 1,000 random numbers selected from a Poisson distribution (lambda = 3). The red line illustrates the alpha level of 0.05 for a one-tailed test. The p-value is less than alpha when the test statistic is higher than the cutoff. In that case, it is customary to reject the null hypothesis and accept an alternative hypothesis; for example, that the spatial pattern of the data suggests observations are clustered rather than randomly distributed in space.
Statistical tests can be one-tailed, focusing on either the upper-tail or lower-tail of the distribution. One-tailed tests only evaluate whether the test statistic is higher or lower than expected (not both). Two-tailed tests evaluate whether the statistic diverges from a central value, and the alpha level is applied to both tails of the distribution.