Linking
One innovative feature of this software is how it links the views in separate windows. This linking allows you to simulatneously explore your data using a variety of different visualization tools. Select a set of regions in a map, say, and their positions in other views of the data are also highlighted (such as the table, box plot, histogram, Moran scatter plot, and scatter plot). You can then drag a selection box through any of the views and watch the other views echo what has been selected.
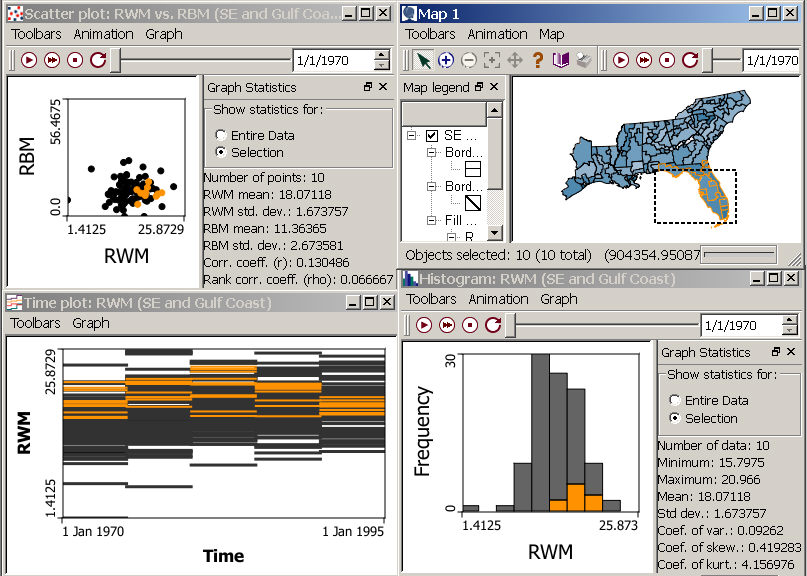
In the image below, Florida has been selected on the map, and the values for Florida regions are shown in the linked scatter plot (left), histograms (bottom right) and time plot (bottom left). If you select individual data points or regions in any of the views, they are selected in all linked views.
All views generated from the same data are linked together automatically. The number of selected objects will be shown in the status bar of all views (the map status bar also shows the coordinates of the cursor). The animation settings, however, are not synchronized, unless you choose to time-link the windows.