


Regression Lines in Scatter Plots
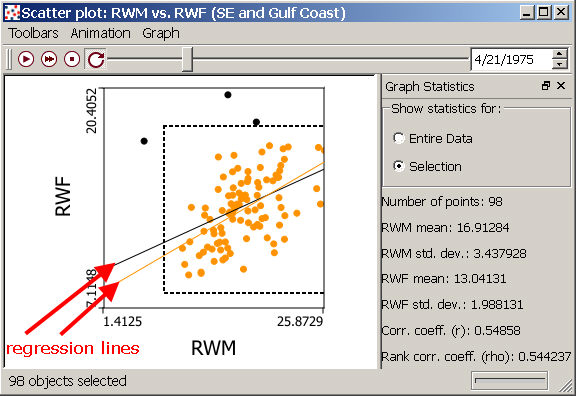
The simple linear regression line (also called the least squares regression line) represents the "best fit" line through your data. This line is useful as a description of the linear relationship between two datasets, or for predicting values if you have a dataset that can be thought of as "dependent" on another dataset (an independent set, plotted on the x-axis). Here we will focus on the regression line as a tool for exploratory data analysis; see the sections on aspatial regression and geographically weighted regression for help on using these tools for predicting unsampled values with a "global" statistical model (aspatial regression) and describing how the relationship between variables changes across space (geographically-weighted regression). Regression lines are only visible on your scatter plot if you have the Graph Statistics window open: To see the line, click on "Graph Statistics" on the "Graph" pulldown menu, which will activate the check-box, opening the window (see right side of image below). Click on it again to remove the check-box, and hide the regression line and the Graph Statistics window.
If you choose to show statistics for a selection, rather than the whole dataset, a second simple linear regression line will appear in orange (see below). In this example, the selection option allows you to see how leaving out the three points shown in black (e.g., not selected) influences the slope of the best fit line.
Interpreting the regression line
In exploratory analyses, the regression line is primarily used as an indicator of the nature of the relationship between two variables. The slope of the line reflects the degree to which the variable plotted on the y axis changes linearly as a function of changes in the variable plotted on the x axis, and the direction of the slope indicates whether this change in y is in the same (positive slope) or opposite (negative slope) direction. If there is no linear relationship between changes in x and y, then the regression line will be flat (zero slope).

Calculation of the regression line
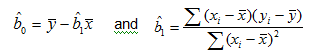
The regression line for data shown in a scatter plot is based on an assumption that you have chosen to plot a dependent variable on the y-axis, and are interested in describing how values of this variable change as a function of an independent variable shown on the x-axis. The equation that describes this line is:

The y-hat is the value predicted from the line, the regression coefficient b0 is the y-intercept, and b1 is the slope. These coefficients are estimated from the observed values using the following equations:
The regression line in scatter plots is meant as a tool for exploring your data (not as a tool for predicting y values), and SpaceStat does not report the equation for the line. If you want to perform a regression analysis, you can use one of the aspatial or geographically-weighted regression techniques to estimate the regression coefficients.