


Interpolation in Maps
You can animate any view in SpaceStat by moving the time slider or hitting the play button. This default type of animation is essentially a slide show, with abrupt changes when data values change. For maps only, you can see a more gradual view of changes over time by asking SpaceStat to interpolate the data. This is strictly a visual effect, essentially smoothing over the abrupt jumps in data values. It is not meant to be statistically accurate, but it does provide a more natural-looking display of time-slice data.
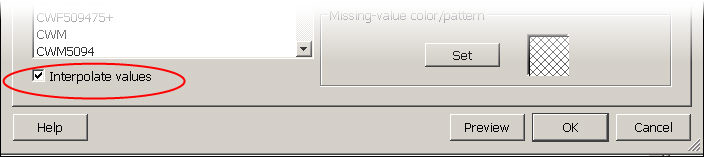
To see the animation interpolated, check the "interpolate values"
box at the bottom of relevant pages within the Map Properties dialog window.
In the example below, this box is checked on the polygon fill attributes
page. You can open the Map Properties window by clicking on the
properties icon  on the map toolbar, by clicking on the
"Map" pulldown window and selecting "Properties",
or by right-clicking on the map and again selecting "Properties"
from the pop-up menu. If you are working with polygons, you have
the option of interpolating values in all of the various polygon attributes
(polygon fill, polygon border, and polygon border width); similarly, for
point geographies, you can again interpolate between attributes that change
over time (point color, size, and sometimes symbols).
on the map toolbar, by clicking on the
"Map" pulldown window and selecting "Properties",
or by right-clicking on the map and again selecting "Properties"
from the pop-up menu. If you are working with polygons, you have
the option of interpolating values in all of the various polygon attributes
(polygon fill, polygon border, and polygon border width); similarly, for
point geographies, you can again interpolate between attributes that change
over time (point color, size, and sometimes symbols).
How the interpolation works
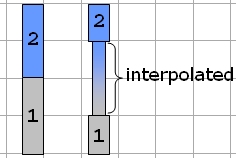 For time-slice data that
is valid for a time range, the value is assigned to the median time for
each range. Then, times in between those midpoints receive intermediate
values, linearly interpolated between the two points, as shown in the
simple example with two data values at left. The left bar, which shows
a sharp color transition between time 1 and 2 is the original un-interpolated
data. The right bar is the interpolated display of the same data, with
the color change suggesting a smooth transition between the midpoints.
For time-slice data that
is valid for a time range, the value is assigned to the median time for
each range. Then, times in between those midpoints receive intermediate
values, linearly interpolated between the two points, as shown in the
simple example with two data values at left. The left bar, which shows
a sharp color transition between time 1 and 2 is the original un-interpolated
data. The right bar is the interpolated display of the same data, with
the color change suggesting a smooth transition between the midpoints.
Interpolation will also hide missing values in the original dataset, unless the location is missing for the entire time range. If there is a value for any time in the range, that value, or an interpolated value between existing values will replace the missing ones.
Except for locations with missing values, SpaceStat does not extrapolate outside the range for which it has data. This means that for an observation associated with the earliest time, the value is applied to the first half of the time range (up to and including the median) rather than linearly extrapolated from the trend after that first median time.