


About Classification
Classified color groups the data into a series of classes. An alternative to classified color is continuous color, which represents all unique values in the data as colors along the gradient from break points you set. The image below shows two maps of the same data. The map on the left shows a continuous color scheme. The map on the right shows a classified color scheme.
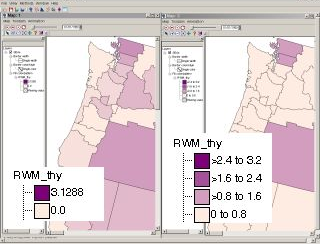
While using classified color groups decreases the resolution of the display of your data, it can allow for quicker identification of important categories, as the eye cannot recognize more than a few distinct categories from the continuous spectrum.
 You can create a classified view of
the data by changing the map properties options (choose "Properties"
from the "Map" menu or the properties toolbar button). Then,
go to the "Polygon Fill Attributes" and choose the "Classified" color mode.
You can create a classified view of
the data by changing the map properties options (choose "Properties"
from the "Map" menu or the properties toolbar button). Then,
go to the "Polygon Fill Attributes" and choose the "Classified" color mode.