


Color Breaks
Color breaks are the end and mid-points of the gradients used in continuous color. The legend for a continuous color scheme shows the break values and associated colors. Locations with values in between the breaks receive a blend of the two break colors.
|
Two breaks
|
Three breaks
|
More
|


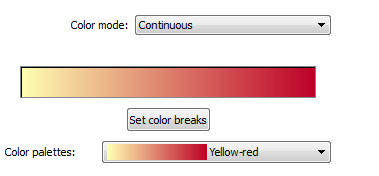
You can customize your palette by choosing the number of breaks, break values, and break colors. First, choose "Set color breaks" from the properties dialog.
The number of breaks
The number of breaks determines the range of colors in your map. The pre-made palettes have a set number of breaks associated with them (the number of colors in the name). A gradient can be between two break values, by rule the maximum and minimum values in the dataset. You can show a diverging color scheme by using three break values. Or you can choose a more complicated scheme with additional internal breaks.
You can change the number of breaks by adding or removing them via the right click menu or the buttons at the bottom of the dialog. You may not remove the first and last color breaks because a continuous color scheme requires at least two break values. If you change these values while choosing your breaks, you have the option to set these colors back to the minimum or maximum values by right clicking. Once you have added new breaks, you can set their colors and values.

Break values
Change the break value by typing a new value in the cell. Or you can use equal intervals, quantiles (unique values), or Jenks to determine break values (see classification methods). The maximum and minimum break values are the maximum and minimum values in the dataset over all times.
Break colors
You can change the break color by double-clicking the color and choosing another.