Changing Geographic Scale
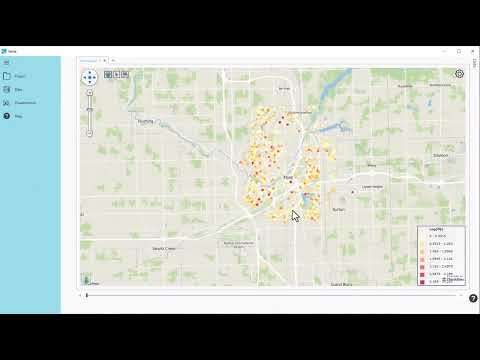
Data are often collected at different spatial scales or supports. For example, water lead levels can be collected at individual residences and viewed on a map of Flint, Michigan. The individual measurements can be aggregated at the ward or precinct level to aid in determining fund distribution for a lead remediation program. Switching between geographies would require a change of geographic scale.
Simply put, changing geographic scale alters the geographic representation of data. Point data, such as the individual water lead level data, can be aggregated into a per ward representation (point-to-polygon) and polygon shape data, such as the water lead levels per precinct data, can be assigned to individual locations (polygon-to-point.) The direction of change depends on what the desired destination geography is relative to the source geography, and if there is a need to match the geographic representation of different datasets.
When deciding how to best represent data, the user can consider the desired geographic format for a final visualization (are individual points or polygons desired?) Knowing the answer to this will help inform the best way to alter the geographic representation of the data.
How change of point-to-polygon is calculated
Vesta simply calculates an arithmetic average for point-to-polygon conversions. The illustration below shows a source geography with point data of different values (represented by the different colors) and an overlapping destination geography with multiple regions designated by the white borders.

Each new region would have its value calculated using the arithmetic average of the point data falling within or on that region's boundary.
How change of polygon-to-polygon is calculated
Vesta uses a method of weighted areas to calculate the values of new regions based on percent overlap from source geography. The illustration below shows a source geography with two regions, 1 and 2.

In this simple example, Vesta would calculate the percent overlap of the new region over each of the two source regions and then calculate a weighted average for the new polygon based on the percentages determined.