Linking and Brushing
Linking and brushing is one of the most powerful interactive tools for doing exploratory data analysis using visualization. Click the video to see a demostration of Linking and Brushing in Vesta.
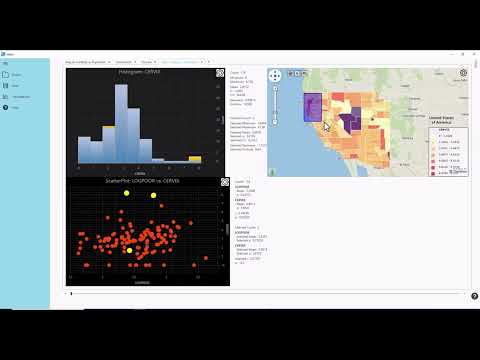
In Vesta, you can get beyond passive views of the data by interacting with the maps and graphs. When multiple visualizations are created, the user is able to select using the select object tool (the cursor icon) observations in one visualization (e.g., histogram, map, table, scatterplot) and see the same observations highlighted in the other visualizations, a feature known as linking. In this same context, brushing consists of the interactive selection of a subset of the displayed data.
Note that since Vesta automatically links all visualizations, you can readily explore multivariate and geographic relationships by displaying several statistical graphics at the same time.