


Besag and Newell's Analysis Results
After you perform a Besag and Newell analysis, you will see two new datasets in the data view, a cluster set in the spatial weights and cluster sets view, a new map, and r results in the Log View.
The new datasets are: the local test statistics and their p-values. The test statistic, l, is the number of regions in the window for the ego location. The p-value is the Monte Carlo p-value, which comes from comparing the observed test statistic to the reference distribution created by randomizing the cases across the study area and recalculating l.
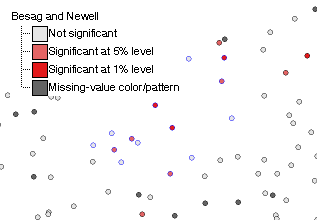
Map and cluster set
The map shows the p-value dataset, classified into significance levels. A location that has a significant l statistic is colored red, while nonsignificant locations are grey. The significant cluster may include several neighbors, not just the point colored red. When you click on the map, you will see the cluster set for each point (significant or non-significant) created by your Besag and Newell analysis. The cluster set for each location is the set of points that were required to meet the case threshold for the ego location. The weights for each of the locations in the set will be listed in the Log View.
You can turn off the cluster set by choosing "Show object neighbors" and then clearing the checkbox next to the cluster set's name.
Global results
Information about the global statistic, r , is written into the Log View. The Log View will contain the number of significant local clusters and its p-value. Significant p-values indicate that there is significant global clustering, more significant local clusters in the geography than you would expect by chance.