


Map Properties for Points - General Tab
You can view the properties by selecting "Properties" from
the "Map" menu, by clicking on the Map Properties  button on the toolbar, or by right-clicking on the map.
In the general map properties tab, you can set how you want to select points in the map, and how to color the points to show they have been selected. When you change your selection options in the dialog, the preview map will update and show you on an example dataset how your changes will look. In the lower left, you can choose if you want to link or hide missing values.
Choose "Preview" to view your selections on the map (but keep the properties dialog open), and then choose "OK" to apply your changes and close the dialog. If you press "Cancel" after "Preview" your changes will not be saved.
Click on tabs and boxes in the image below for more information.
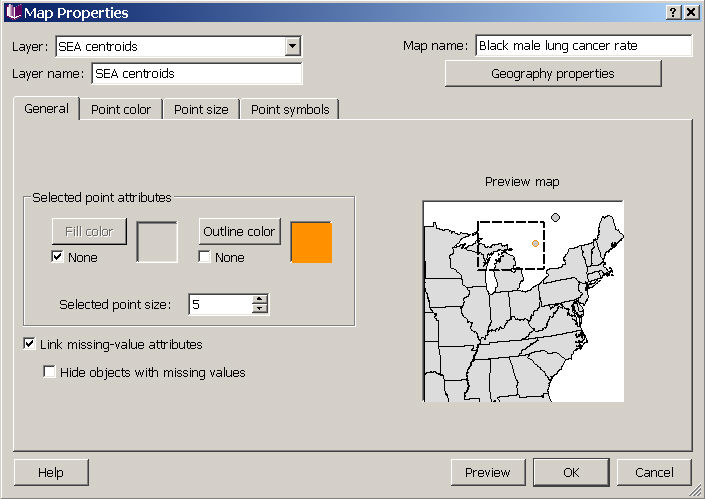
Selected point attributes
You can change the fill color, outline color, and point size for displaying the points you have selected on the map. Your choices are shown in the preview map on the right. Note this preview shows both a point geography (with just two points) with a polygon geography (US states) in the background.
Missing-value display
On the general tab, you can choose to link missing value attributes across all datasets used in the map, or to hide objects with missing values. These options, and other options related to how missing values are displayed in your maps are described in missing values in map view. For point geographies, linking missing value attributes is the default (thus, if the value of any of the maximum of three different datasets used to characterize points as missing, the point is shown with a missing value symbol. This is the default for points, but not for polygons, because it is harder to see indications of missing values shown by color changes or point sizes.