


Correlation Coefficients
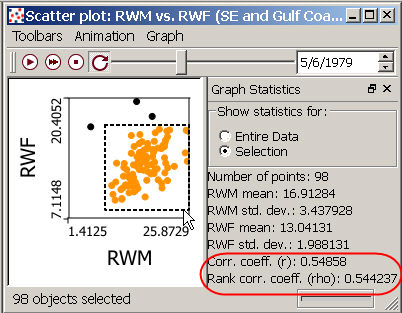
SpaceStat presents measures of simple linear correlation as a tool for interpreting the output of some plots (e.g., scatter plots), and analyses (e.g., aspatial linear regression). These measures describe the extent to which there is a linear association between two variables plotted on an X and Y axis, but unlike for regression-based tools, a functional dependence between the two variables is not assumed. These coefficients appear at the bottom of the Graph Statistics page associated with scatter plots (see circled area in image below), and in the log output for regression. Note that in scatter plots, you can view correlation coefficients for all of the data in the plot, or for a subset by clicking on the "Selection" option under "Show statistics for"-- in the image below, the coefficients shown are for just the selected points (shown in orange). Also note that if you compare correlation coefficients form the scatter plot to ones shown in regression output, they may differ slightly due to differences in how missing values are handled.
SpaceStat computes two measures of correlation - "r", or the "simple correlation coefficient", also known as the Pearson product moment correlation coefficient, and "rho", Spearman's rank correlation coefficient. The simple correlation coefficient is appropriate for two data sets that do not seriously deviate from the assumption of a normal distribution (i.e., sampled from a bivariate normal population), while the Spearman's coefficient is a non-parametric approach that can be applied to data that do not meet the assumption of normality.
For both coefficients, values range from -1 to 1, with values further from 0 indicating stronger associations between the two variables. If the correlation coefficient is positive, then an increase in one variable is associated with an increase in the other variable (left graph in the figure below), while negative correlation coefficients indicate that as one variable increases, the other decreases (center figure). Correlation coefficients near 0 (positive or negative) suggest that there is little association, or correlation, between the two variables (right figure, below).

The correlation coefficient is calculated as:

To obtain the Spearman's rank correlation coefficient, this same equation is applied to the ranks for each value in the two datasets, rather than the actual data. If it would be appropriate to apply either measure (i.e., the data do not deviate seriously from the assumption of bivariate normality), then the rank correlation coefficient is roughly 90% as powerful as the simple correlation coefficient (Zar 1999).