


Histogram
You can make a histogram to display the distribution of any of the data
in your project. To create a histogram, choose " Histogram" from the "View" menu or the
icon visualization toolbar, and then select the geography
and dataset.
Histogram" from the "View" menu or the
icon visualization toolbar, and then select the geography
and dataset.
Like most views in SpaceStat, the histogram can be animated; use the animation toolbar to scroll through the temporal range of your data. The histogram view is also linked to other visualization tools. For example, you may wish to select locations that comprise the upper tail of the distribution of a dataset, and see where those values occur on the map. Finally, you can also time synchronize this plot so that it animates in conjunction with another view.
Graph statistics
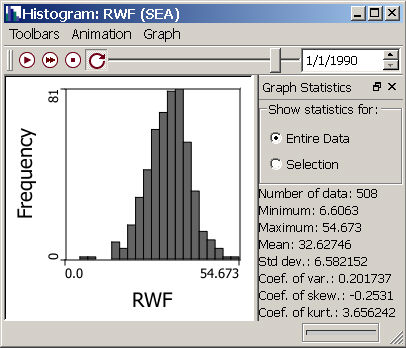
The Graph statistics box on the right side of histogram window provides values for a series of descriptive statistics for your dataset. If you want to obtain descriptive statistics for a subset of values in the dataset, select a subset of the bins in the histogram and choose the Selection option in the Show statistics section within the Graph Statistics window. You can undock the Graph Statistics window by clicking on the symbol in the upper right corner, and hide it by clicking on the button. Undocking allows you to move the window around; if you choose to close the window, you can view it again by clicking on Graph Statistics in the Graph drop-down menu.
In addition to presenting the number of locations in your dataset, the minimum, maximum, mean value, and the standard deviation, the Graph Statistics box also provides the values of three coefficients that describe the shape of the distribution of your data. These are briefly described below. For more information, see an introductory statistics text such as Remington and Schork (1985).
-
Coefficient of variation: A measure of variability calculated by dividing the mean value by the standard deviation.
-
Coefficient of skewness: A measure of the symmetry of the distribution around the mean value. Typically this measure is used to help determine if the observations in a dataset meet the assumptions of a normal distribution. Note that the data in the image above are slightly negatively skewed, and thus the value of the coefficient is negative.

-
Coefficient of kurtosis: A measure of the "heaviness" of the tails, or the peakedness of a distribution with respect to the length and height of the tails. Distributions that are relatively flat and have short tails will have low kurtosis values, while those that are tall and pointy with long tapering tails will have high kurtosis values.
The animation and graph toolbars
The far left pull-down menu in the histogram window allows you to hide or show the Animation (shown by default) and Graph (hidden by default) toolbars. Note that if you wish to change the time step size for animations, this option is available from the Animation pull-down menu, but not from the toolbar.
From the Graph drop-down menu or toolbar, you have the following options:
-
 Change the look of
your histogram, or change the window title and the axis label by choosing
"Properties".
Change the look of
your histogram, or change the window title and the axis label by choosing
"Properties". -
 Print
your histogram (you can also use Ctrl+P).
Print
your histogram (you can also use Ctrl+P). -
 Export
an animated histogram.
Export
an animated histogram. -
Copy
a histogram to the clipboard, and then paste it into other software
program files.
-
Turn the Graph Statistics window off or on (click on this line, and the window will toggle on or off).