


About Maps
SpaceStat displays maps in a two-pane window. The left pane holds the map legend, which lists the geography of the data, and the variables that are plotted, along with and their symbols and color schemes. The right pane contains the map itself. The three menus across the top of the window allow you to hide or show the Animation and Map toolbars (click on "toolbars"), to control aspects of the animation, including the time-step size (click on "Animation"), and to use all of the tools in the Map toolbar, and to access several other functions (click on "Map"; see below for details).
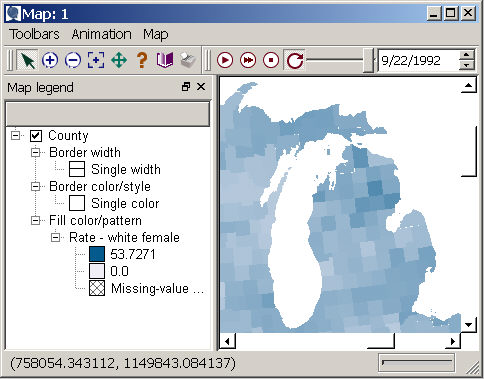
The left panel: the map legend
The map legend panel lists all the layers in the map, and provides a way for you to manage these layers. You may show or hide a map layer by checking or clearing its associated box using the mouse; displayed layers have a check in the box next to their name. If you add an additional dataset from the same geography to your map, SpaceStat will give it a sequential layer name -- for example, if another dataset for the county geography was added to the map shown above, the name of this layer would appear as "County 2", with the specific dataset identified by default under the "Fill color/pattern" heading (where you see "Rate - white female" in the example). You can always change which datasets are used to determine various properties of the map in the Map Properties dialogs. You can delete a layer from a map by selecting it and then hitting the delete key, or by selecting it, and then right clicking to reveal the "remove" option.
To change the order of layers in a map or datasets in a layer, drag layers up or down the list.
You can add layers to an existing map by right-clicking a geography or dataset in the data view and choosing "View in map". Or, you can click on a dataset in the data view and drag it into the left panel.
You can close the legend by clicking on the [x] button on the top right of the panel labeled "Map legend", or by unselecting "Legend" under the "Map" pulldown menu. To bring the legend back, return to the Map pulldown menu and click on the blank space to the left of "Legend" to make the check mark and the legend re-appear.
The right panel: the map pane
Your map appears in the right pane of the map window. You can use the map toolbar to pan, zoom, select, and query the map. By default, the entire extent of your data will appear in the map pane, but if you zoom or pan within the data such that some areas are hidden, scrollbars will appear within the pane, providing an additional method for shifting the area shown in the window. You can view a slideshow of any of the datasets associated with a particular map in this window by using tools from the animation toolbar.
If you right click within the map pane, a menu will appear listing options for letting you change the cursor to a query tool, allowing you to zoom in to a selected object, to invert your selection, or to create a new subset geography from selected objects. The right click menu will also give you the option of converting the cursor to a tool for showing spatial weight sets for selected objects, or for accessing the map properties dialog, or printing options.
Map controls
You can interact with the map using the map or animation toolbars; if you wish to hide these toolbars, you can do so and still access of their options from the "Map" and "Animation" pulldown menus. The "Animation" menu also includes the option for setting the time-step for animations. From the "Map" menu, you can also hide or show the legend (see above), copy an image of the map to the clipboard, export an animation, print, or view map properties.
Status bar
In the lower left of the map, the location portion of the status bar shows the most recent coordinates of the mouse pointer, and will tell you how many objects are selected when you are selecting or querying objects. The coordinates are in the projection of the geography, viewable in the geography properties. In the lower right, there is a progress bar that indicates when SpaceStat is drawing or re-drawing map contents. Sometimes with very complex geographies, or when many layers are present in the same map, updating the map can take a few seconds -- action in this box shows you that the change is "in-progress."