Scatter Plot Properties - Symbol
In the point symbol tab, you can set how you want the points in your scatter plot to look by specifying their shape. If you want to specify something other than a single symbol for all of the points in your plot, you need to choose a covariate dataset to use for grouping points. After you've chosen a dataset, you can either see classified or qualitative symbols, depending on your data type. Note that you can use a different dataset for the point color, size, and symbol dialogs, allowing you to show characteristics of more than one covariate dataset, but showing more than one covariate is likely to lead to a very confusing scatter plot.
A box in the lower right allows you to choose a different symbol for missing values in your covariate dataset (the default is an "X").
Choose "Preview" to view your selections to the map (don't close the properties dialog), then choose "OK" to apply your changes and close the dialog. If you press "Cancel" after "Preview" your changes will not be saved.
Click on tabs and boxes in the image below for more information.
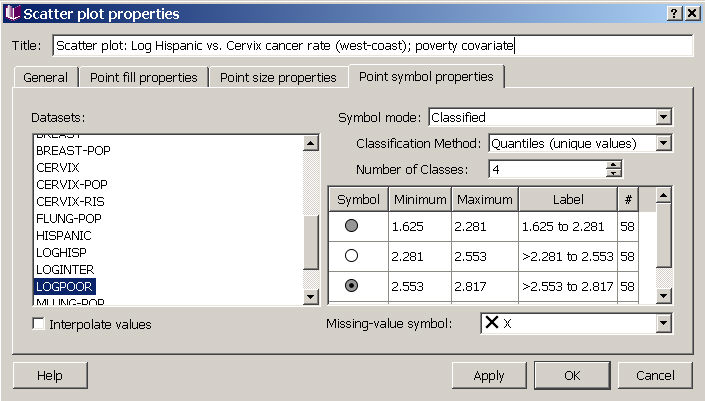
For single symbol, you can change the symbol for all points from the menu (below). For classified or qualitative symbols, you can accept the default choices or customize the look of each class in your scheme by left clicking in the box for each symbol. The same set of choices is also available for indicating missing values in your covariate dataset.