Qualitative Color, Widths, or Sizes
Qualitative color represents unique values as separate colors. This is most useful when the values do not have an inherent arithmetic order (such as "high-high, low-low"). Similarly, you can group data for display in other map attributes, such as widths of lines or polygon borders, or sizes of points. The same logic applies to classification of these attributes, but to simplify the text below, we use color as the subject. This qualitative grouping scheme can only be used for text data.
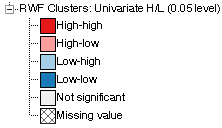
The legend in the left part of the map view shows the color for each category in the dataset. You can use a qualitative classification for coloring polygons, points, or lines; and can also use this scheme for setting polygon border attributes, polygon border width, line width, point size, and point symbols.
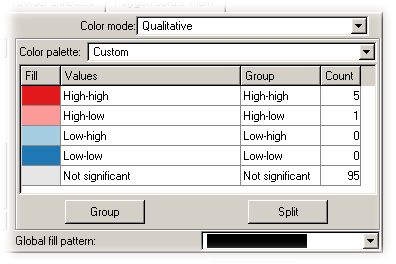
Using the Map Properties Polygon Fill tab you can group or split categories and change the displayed colors and fill patterns.
Grouping or splitting categories
To group categories, select two or more categories and choose "group". You will be asked to name the grouped category. Then, all values in the group will have that group name and the group count next to each value will show the group count over all values.
To split grouped categories, select the category and choose "split." The selected category will be returned to the original state of one value per group.
Changing the colors
Within each color mode, you can choose different colors to create an informative map.
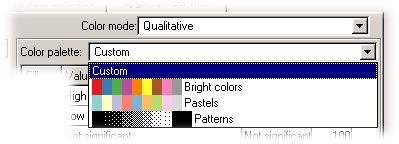
You can change the color for each category by double-clicking on the color in the fill column, and then selecting a new color. You can also choose from several color palettes to change all of the colors for all of the categories at once.