Disparity Results
After you run a disparity analysis, SpaceStat will produce a report in the log, and 9 new datasets (if you choose "both" tests here --4 if you choose one test), and three maps.
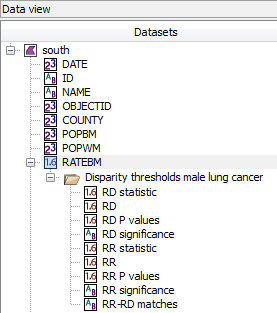
Disparity Datasets
The new datasets be placed in a folder with the default name "Disparity" (which you may have renamed here). This folder will appear beneath the dataset that you entered as the "Target" on the input page. The first four datasets, labeled RD (Rate Difference) refer to the absolute statistic, while the next for (RR, for Rate Ratio) refer to the relative statistic. Within these two sets of datasets, the RD or RR file give the actual difference in rates or ratios, the "statistic" sets report the calculated value of the relevant statistic, the "P values" sets give the p-values, and the "significance" set is a categorical representation of whether each location showed significant disparities (as defined by your alpha value and your method for dealing with multiple tests). Finally, the RR-RD matches dataset compares the two significance datasets to see how well the results match for the two statistics. By default, the significance and matches datasets appear in maps after you run the analysis (see below).
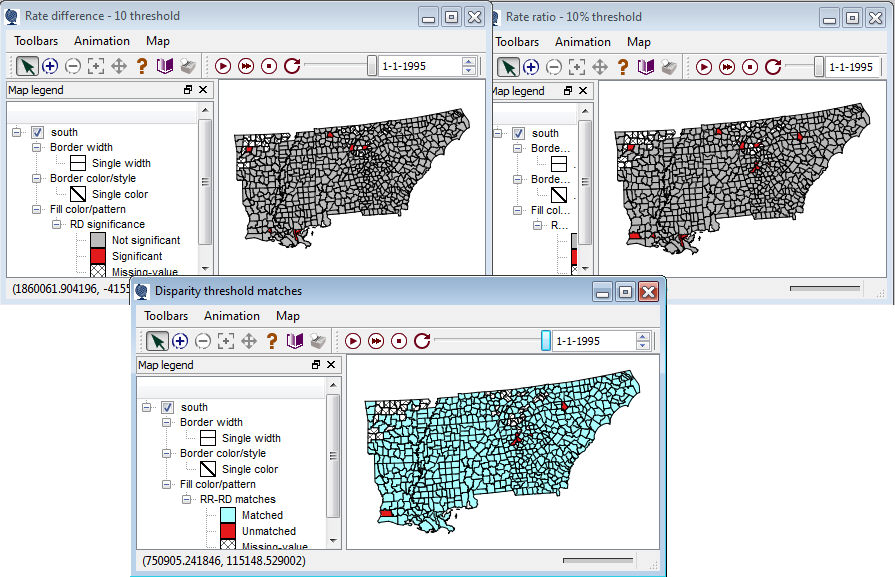
Disparity Maps
As noted above, three of the output datasets will automatically be mapped for you -- the RD (rate difference) significance values, the RR (rate ratio) significance values, and the RR-RD matches. You can right click on any of the other datasets to add a map of those values as well. Below, we show these three output maps for the one-sided analysis conducted on the "Calculate" page. On the "About" page, in addition to the three maps that are automatically created, we show the differences in rate (RD) and in ratios (RR) datasets produced by the two-sided test on the same datasets (lung cancer rates in black males, with the rate for white males as a reference). The missing values fill pattern indicate locations for which a disparity statistic could not be calculated, such as areas missing population-at risk values.