


About the Disparity Statistics
SpaceStat includes two related methods for assessing the magnitude and statistical significance of disparities, or differences, between rates. From a public health perspective, The Centers for Disease Control and Prevention (CDC) defines a disparity as "the quantity that separates a group from a reference point on a particular measure of health that is expressed in terms of a rate, proportion, mean, or some other quantitative measure" (Keppel et al. 2004, p. 7). Our implementation of these tools follows the CDC's suggested standard approach for defining the rate and the reference population. When combined with several options for dealing with multiple statistical tests, the disparity statistics implemented in SpaceStat provide three major advances over other measures that have been used to contrast disease patterns in two sub-populations in the same locations. First, the techniques in SpaceStat allow you to examine both absolute and relative differences in disparities, which helps address problems associated with characterizing and interpreting changes in rates over time. For example, if overall rates of some disease are decreasing, leading to a decline in the absolute difference between population groups, you may still see an increase in the relative disparity between groups. Thus, using both an absolute and relative rate is recommended by the CDC (Keppel et al. 2004). Second, for cases where disparities are strong, we have implemented techniques for going beyond the original statistics to evaluate exceedance of thresholds in disparity. Third, we provide three options for dealing with problems associated with multiple testing, which can lead to increased false positives (detections of disparities that are not actually present) due to the large number of tests applied in geographies with many spatial units (Goovaerts et al. 2007).
Through a simulation study comparing six test statistics that assess absolute and relative differences between cancer rates measured in distinct subpopulations, Goovaerts et al. (2007) found the (1) absolute, or difference statistic, and the (2) relative, or ratio statistic implemented in SpaceStat consistently showed higher power and fewer false positives than other measures. Interestingly, these researchers found that, for their datasets, these measures actually had lower false positive rates when NOT corrected for multiple testing. Used together, these two statistics provide a balanced approach that helps avoid misleading conclusions regarding changes in the magnitude of disparities over time or across geographic areas, and produce realistic assessments of the proportion of false positives (type 1 error rate, or alpha value). Although the need to control for multiple testing was not supported in this simulation study, other data sets and applications may show different patterns. Thus, SpaceStat also provides three options for controlling for multiple testing when performing disparity analyses (changing the alpha, an extended Simes correction, and a False Detection Rate correction). Goovaerts et al. 2007 also demonstrated that one-tailed hypothesis tests can be useful tools for comparing a-priori hypotheses regarding the direction and magnitude of differences between two sets of rates. With SpaceStat you now have the ability to test whether a difference between rates exceeds a certain threshold, rather than simply testing for a difference in rates.
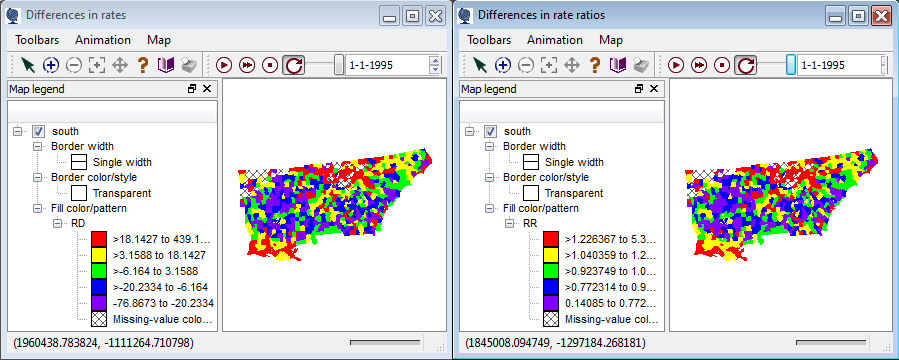
Below, we display output from a disparity analysis on lung cancer mortality rates for black males (target population in the analysis) in comparison to the value for white males (reference population) in counties in the southeastern US. The pair of maps shown below display the calculated differences in rates. These maps are not automatically generated, but can easily be produced by adding the two of the output files (the file labeled "RD", for rate difference, and the file labeled "RR" for rate ratio) to a map -- here we have classified the data into five quantiles (see Map Properties).
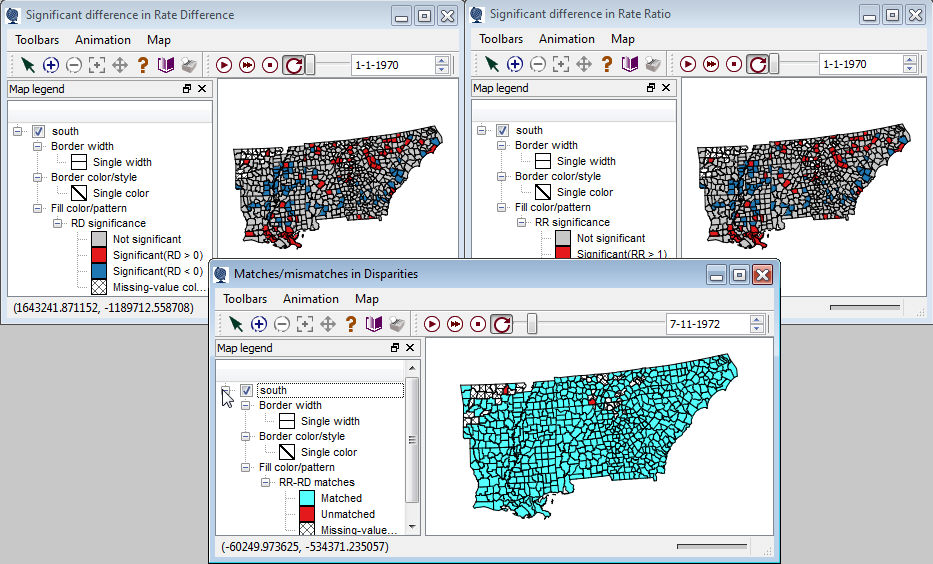
The set of maps shown below are automatically generated when you run a disparity analysis, and in this case show whether the disparity statistic for each county was significant at p = 0.05 (with no correction for multiple tests). The map in the center indicates mismatches in the detection of significant disparities by the two methods. Note that many counties at the northern edge of this study area had missing values, and that the two statistics gave very similar results for this more common cancer---you might expect more mismatches across the two disparity measures when working with data on rare cancers.
Click here to see the disparity equations, or here to look into tests with thresholds.
To see how to fill in the task manager boxes, click here.