Map Properties - Overview
The map properties dialogs allow you to change the way your data are
displayed in the map. You can view the properties by selecting "Properties"
from the "Map" menu, by clicking on the Map Properties  button on the toolbar, or by right-clicking
on the map. Once you have accessed the set of dialog boxes, you can change
the how items are selected (General tabs for polygons,
points, and lines),
can change the color scheme for polygons,
points, or lines,
and can change polygon border attributes,
polygon border width, line width, point
size, and point symbols.
At the bottom of each page, there are additional options for representing
missing values in your dataset.
Once you have this window up, you can change properties for any
of the layers in your project. Switch between layers by using the "Layer"
pull-down box in the top left corner of the window.
button on the toolbar, or by right-clicking
on the map. Once you have accessed the set of dialog boxes, you can change
the how items are selected (General tabs for polygons,
points, and lines),
can change the color scheme for polygons,
points, or lines,
and can change polygon border attributes,
polygon border width, line width, point
size, and point symbols.
At the bottom of each page, there are additional options for representing
missing values in your dataset.
Once you have this window up, you can change properties for any
of the layers in your project. Switch between layers by using the "Layer"
pull-down box in the top left corner of the window.
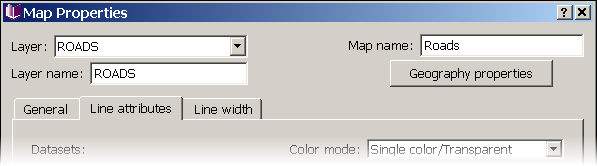
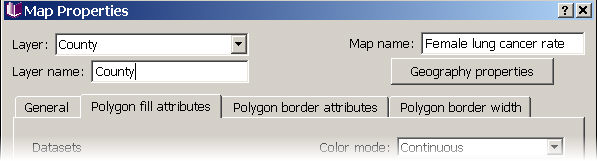
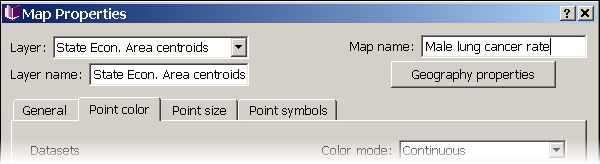
The top of the dialog allows you to change the map name (what shows in the title bar of the map window) or the layer name (displayed in the legend pane of the map). To change the name of a dataset, you must edit its name in the data view. You can also view the data source or geography properties from this dialog by pressing the "Geography properties" button.
The options on the different tabbed pages for polygon, point, and line geographies vary slightly, and are described in more detail in geography-specific sections of the Map properties help.
Click on the tabs in the images of the Map properties windows (below) for more information.
Map properties for polygon data
For point data
For line data