Map Properties for Points - Point Size Tab
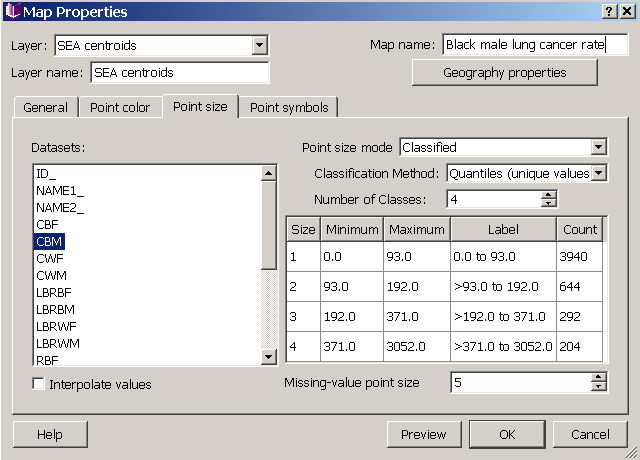
You can make all points on your map the same size (increasing or decreasing the size from the default), or can use point size as a way of providing additional information about your dataset. If you want to show points of different sizes, you need to choose a dataset for determining the size distribution (left side of dialog box), and then an appropriate size classification mode. Left click in the box for point size to change the size in your grouped data. Note that you can choose a different dataset than you did for the point color and/or point symbol if you wish to show characteristics of different datasets (in the same geography) in one map. Here we have used the count of black males (dataset CBM), while for determining point color, we used the cancer rate for black males (RBM).
If you choose point sizes that vary in time, you can check the interpolate values box (lower left corner) to smooth the transitions in an animation or map movie. Also, you can choose a size for missing value points in the lower right corner.
Choose "Preview" to view your selections in the map view (don't close the properties dialog box while you preview, or your changes will be lost). When you have finished choosing a fill scheme, choose "OK" to apply your changes and close the dialog. If you press "Cancel" after "Preview" your changes will not be saved.
Click on tabs and boxes in the image below for more information.