


Color, Width, and Size Modes Overview
You can view polygon fill, polygon border color, line color, and point color in one of several color modes: single color/transparent, qualitative (categorical), continuous, or classified color. You can also use single, qualitative, and classified schemes to show variations in your data by modifying the polygon border width, line width, point sizes, and point symbol attributes.
For fill and border color, you can customize the default color scheme in each color mode to fit your needs. For non-color attributes (border or line widths, point sizes), the chosen mode determines how the variation in widths/size is distributed. In the table below, we use color variation to illustrate the different modes.
|
Color, Width, or Size Mode |
Example Legends |
|
|
|
|
|
|
|
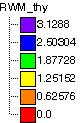
Legend shows colors associate with break points, not ranges. Map colors are stretched between break colors. Shows the complexity of the data. Compare to classified. |
   |
|
Legend shows colors associated with ranges. Map colors are limited to the set shown. Simplifies map by grouping observations. Compare to continuous. |
|

 for labels, categories, or statistical output
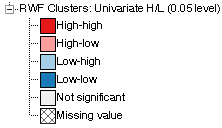

 for numeric data,
integer or decimal.
for numeric data,
integer or decimal.
SpaceStat uses continuous color as a default, and all of its default color specifications and designs were developed by Cynthia Brewer (http://colorbrewer.org/). ColorBrewer.org provides a comprehensive, interactive, and visual means to examine which map color schemes are best for which purposes.