


Geographically Weighted Regression Output
Unlike aspatial regression output, output from running a GWR analysis does not include a "global" result in the log view. Since the point of this type of analysis is to evaluate how the relationships among variables vary across space, all of your output (except for a description of your model run that appears in the log) will be in a GWR output folder that will appear below your dependent variable in the Data view.
Here, we will show the output from the model we used to illustrate running a GWR model on the "Perform" page.
Summary of the model run
After clicking to the run method page and then selecting "Run", we see the following output in the log view, beginning with the summary of the model run. Note that below the summary, the log shows the first five steps of the Cross-validation process to determine the optimum bandwidth for our Bisquare-fied regression weighting method.

Output datasets
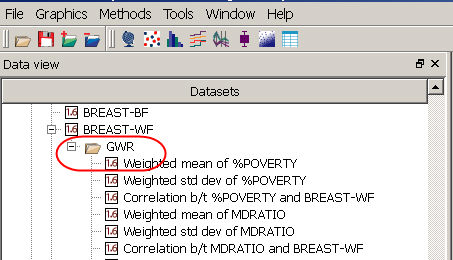
At a minimum, GWR produces output datasets for the dependent variable's expected values, residuals, and standard errors (highlighted in orange in the image below). Checking the "Output regression term datasets" will add correlation coefficients between the dependent and each independent variable, along with each variable's weighted means (datasets highlighted in blue below). Checking the "Output independpent variable statistics" option will add datasets (highlighted in pink) for each regression coefficient, the associated p-values, regression parameter R-squareds (linear models only), and the local model R-squareds (linear models only). Note that if you roll the cursor over the dataset name, a popup box will give you additional information. In the image below, the cursor is over the "Coefficient 2 P value" dataset, and the popup box tells you that this p-value dataset refers to the MDRATIO variable. Note that significance values in regression output are reported as "0.0" if they are smaller than 0.000001.
All of the new datasets will appear if you open the data table for your geography. If you right click on any dataset, you can: Add it to a new or existing map, rename or remove it, convert it to a different type (e.g., from a decimal to a string dataset), or view it's properties. Specifically, the properties for datasets created by regression analyses repeat the information that appears in the run method window when you perform the analysis. You can also use the aggregation method to convert the dataset to a polygon geography to make interpreting your results easier.