Map Properties for Polygons - Border Attributes Tab
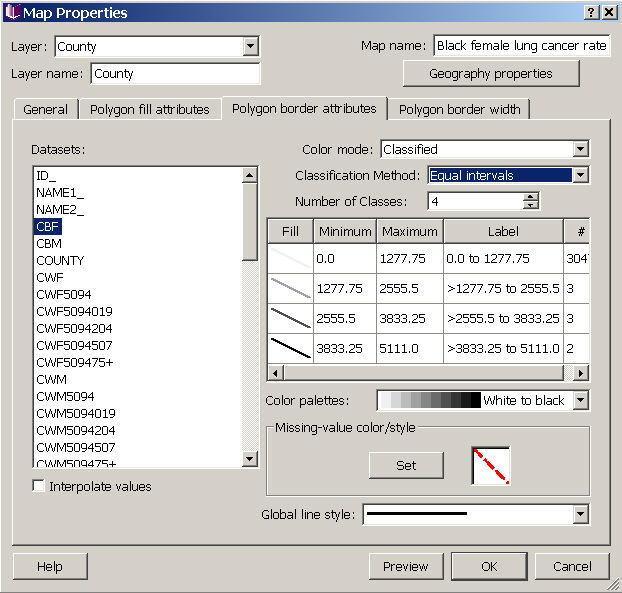
In the border attributes tab, you can set how you want the polygon border to look by specifying line color and style attributes. If you want to specify something other than single color, you need to choose a dataset and then an appropriate color mode. Datasets can be represented in one of several color modes: single color, qualitative, classified, or continuous. To create "custom" categories, choose the classified option, choose custom for the classification method, and then enter the number of classes. You can then type in Min and Max values for each group. Once you have divided the data, you can further modify how each category is colored and the line style by clicking on the "Fill" box for each group. Note that you can choose a different dataset than the one you used for selecting polygon fill if you want to show patterns for two variables on the same map. In the example below, we have used the "Count of black females" dataset to show the polygon border, while on the polygon fill attributes page, we chose the cancer rate for black females for coloring the polygons.
In this dialog, you can change the attributes of the polygon borders shown in the map and/or make borders transparent. You can change color and line style, applying a single color or line style or various color modes and line styles (e.g. solid, transparent, dashed). To create "custom" categories, choose the classified option, choose custom for the classification method, and then enter the number of classes. You can then type in Min and Max values for each group. Once you have divided the data, you can further modify how each category is colored and filled by clicking on the colored box for each group (in the fill column, which is partially hidden in the image below -- to the left of the "Minimum" column).
If you check the interpolate values box in the lower left, the transitions between border attribute classes will be smoothed during animations of the data. Note that a separate set of attributes can be chosen for polygons with missing values in your datasets.
Choose "Preview" to view your selections in the map (don't close the properties dialog box while you preview, or your changes will be lost). When you have finished choosing a fill scheme, choose "OK" to apply your changes and close the dialog. If you press "Cancel" after "Preview" your changes will not be saved.
Click on tabs and boxes in the image below for more information.