Map Properties for Polygons - Border Width Tab
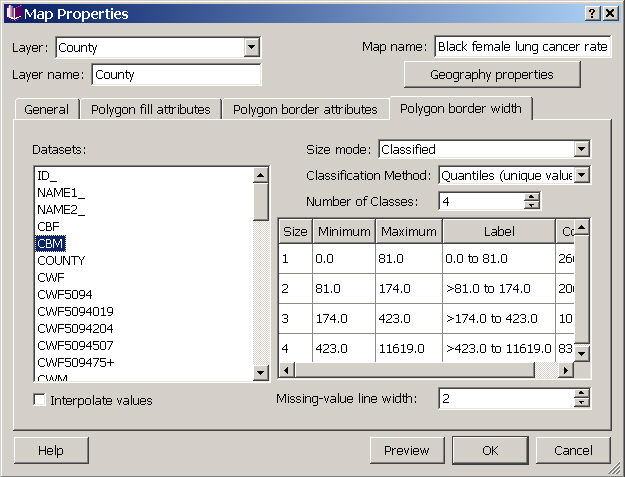
You can change the border width for polygons in the map. If you want to specify something other than single width, you need to choose a dataset for determining the width distribution, and then an appropriate mode. Datasets can be represented in one of several color modes: single color, qualitative, classified, or continuous. To create "custom" categories, choose the classified option, choose custom for the classification method, and then enter the number of classes. You can then type in Min and Max values for each group. Once you have divided the data, you can further modify the width by clicking on the size box for each group. Note that you can choose a different dataset than you did for the polygon fill if you wish to show characteristics of two different datasets (in the same geography) in one map, or you could even use three different variables (one for fill, one for border attributes, and one for border width), although this is likely to produce a map that is very hard to interpret.
If you choose border widths that vary in time, you can check the interpolate values box (lower left corner) to smooth the transitions between border widths in an animation or map movie. Also, you can chose specific polygon border width characteristics for objects with missing values in the lower right corner.
Choose "Preview" to view your selections in the map (don't close the properties dialog box while you preview, or your changes will be lost). When you have finished choosing a fill scheme, choose "OK" to apply your changes and close the dialog. If you press "Cancel" after "Preview" your changes will not be saved.
Click on tabs and boxes in the image below for more information.