Map Properties for Lines - Line Color and Style
In the Map Properties line attributes dialog, you can choose which dataset to view (by selecting the dataset from the data sets column on the lower left), and then you can customize its color mode and color scheme. Datasets can be represented in one of several color modes: single color, qualitative, classified, or continuous. Once you have chosen a scheme for dividing the data, you can further modify how each category is colored by left clicking on the color box for each group. You can also left click directly on the box showing the line color and style to change both of these attributes, and similarly can change the pattern for missing values (see bottom right of dialog box).
You can also choose to have SpaceStat interpolate values during animations or map movies to smooth the transitions between different line attributes if a line's class changes over time.
Choose "Preview" to view your selections in the map (don't close the properties dialog box while you preview, or your changes will be lost). When you have finished choosing a fill scheme, choose "OK" to apply your changes and close the dialog. If you press "Cancel" after "Preview" your changes will not be saved.
Click on tabs and boxes in the image below for more information.

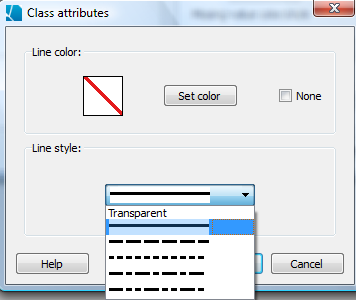
When you click on a box showing the line characteristics for a particular group, you will open a new dialog box like the one below that allows you to select the color and line style. Similarly, the global line style uses the same pulldown menu to offer you choices for how lines are represented.