


Overview
Our unique space-time platform allows you to conduct advanced spatial and space-time analysis within a fast, user-friendly environment. Visualization capabilities allow you to view the data in your project, display these data in maps and graphs, and perform statistics to evaluate spatial pattern. The space-time platform also incorporates a temporal component which lets time be a dimension of the data, rather than an attribute linked to each object in the dataset. Thus, almost all views of the data can be animated, from maps to histograms to tables. But, SpaceStat does more than just animate your data, it allows you to make statistical inferences about patterns in the data as well. SpaceStat allows you to view, interact with and statistically analyze your space-time data so that you can make informed decisions.
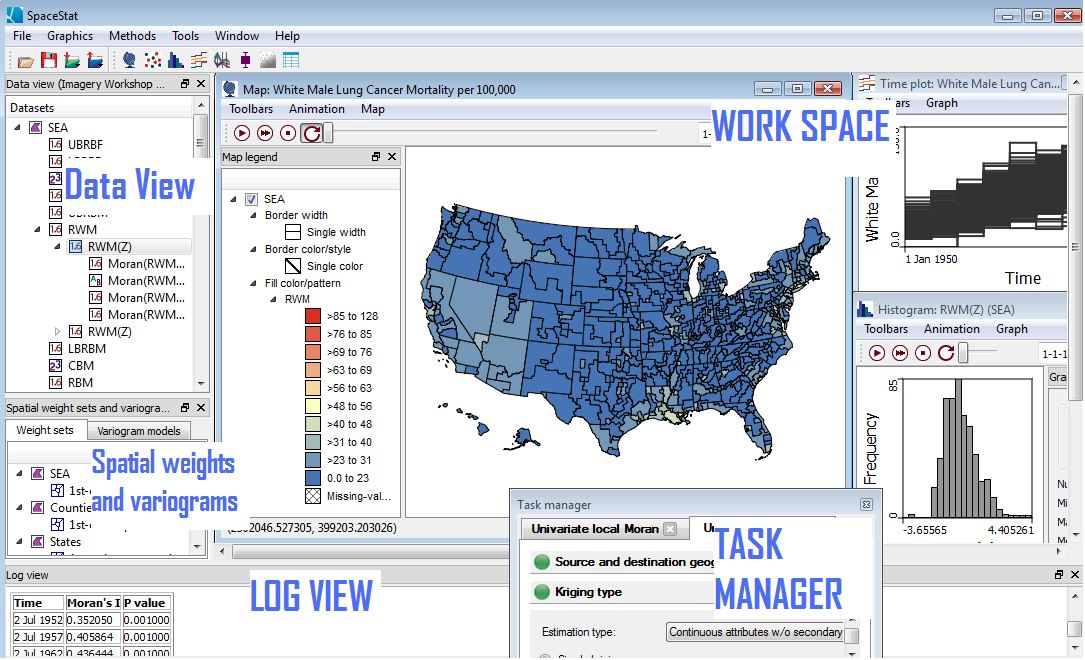
The space-time platform interface consists of a few components: the data view, spatial weights view, and log view; the task manager; the toolbars; and a workspace containing the maps and graphs you choose to generate.
Right-clicking in the toolbar area will bring up a list of the toolbars and views, which allows you to "uncheck" those you don't want to see. You can retrieve toolbars and views by selecting them from the Window menu. In the view below, the views, and tools bars are shown in their default locations, but these can all be docked or free-floating. The data, spatial weights, and log view can also be layered with access tabs. You can also move the graphs, plots, and maps within the workspace. You can click on the image below for more information about the elements shown.
Data View
The data view is a visual display of all of the data in your project. Unlike other GIS programs, which tend to organize the data by tables, this view organizes the data by the associated geography, and all variables associated with that geography are listed.
The data view occupies the left side of the application window as a default.
Weight sets and Variogram model View
This window houses both the spatial weights view and the variogram model view. This view can be hidden and brought back by going to the "Window" menu and selecting "Spatial weights and variogram model view".
The spatial weights view is a visual display of the spatial weights sets you have in your project. It lists the weights sets available, and it is where you create new weights sets to use in statistical methods or to view in the map. The variogram model view is a visual display of the variogram models you have in your project. You can use this view to organize and edit your variograms.
Log View
SpaceStat records text-based information from your analyses in the log view: the screen below the Data view and Map. You can move the log or resize it as you like. You can also close it and re-open it by going to "Window" and selecting "Log view."
Task Manager
The task manager guides you through implementation of SpaceStat's collection of data transformation and statistical methods.
Toolbars
SpaceStat has four tool sets for you to use: Project, Visualization, Animation, and Map tools.