


Selection in maps and plots
You can select data in a map or any linked graphical view in several ways.
§ Use the selection cursor
from the map toolbar to select
individual objects, or click it to open a selection rectangle anywhere
in the map. You can change the properties of the selection rectangle on
the "General" pages of the Map
Properties dialogs for polygons,
points, or lines.
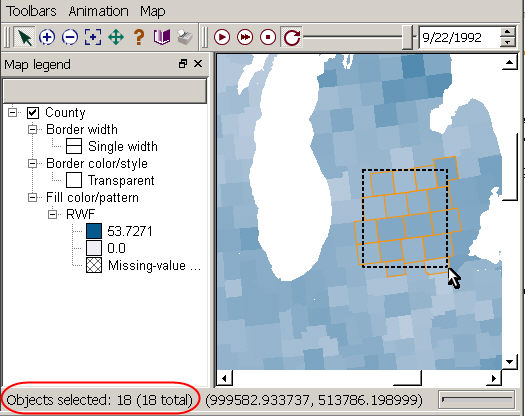
Note that the default color for identifying selected objects is
orange (see the image below) but you can change this in map properties.
The number of selected objects is tallied at the bottom-left of
the map window, shown circled in red in the image below.
to select
individual objects, or click it to open a selection rectangle anywhere
in the map. You can change the properties of the selection rectangle on
the "General" pages of the Map
Properties dialogs for polygons,
points, or lines.
Note that the default color for identifying selected objects is
orange (see the image below) but you can change this in map properties.
The number of selected objects is tallied at the bottom-left of
the map window, shown circled in red in the image below.
§ You can also select multiple objects by holding down the "shift" key and clicking on locations in your map; unlike the selection box, this method allows to select sets of non-adjacent locations.
§ 
§ Click to select an item anywhere within any graphical view (histogram, scatter plot, box plot...); click and hold down the button while moving the cursor to create a selection rectangle that will allow you to select multiple items.
§ Select by value in the map:
o Select by class in a classified color scheme by right clicking on the class of interest in the map layers pane.
o Select by category in a qualitative color scheme by right-clicking on the category of interest in the map layers pane.