
On the surface, Geographic Information Systems (GIS) and geospatial analysis can seem quite mysterious. Where does all that data come from? How can it be rendered into maps? Is it really possible to ask questions about maps—to use them for analysis? Let’s take a closer look at the 4 main components of GIS.
#1. Data
Geospatial data is all around us; it is actually unavoidable! Let’s briefly explore mathematical notation, followed by some concrete examples.
Geospatial practitioners rely heavily on the 4Ws— What, When, Where, and Why.
- Attribute(s) – (The what)
- Location – (The where)
- Time – (The When)
- Process – (The Why).
At a minimum, GIS data will have a location. For example, suppose you are recording where cases of bladder cancer were diagnosed. You might then record just the location, usually in a coordinate system such as latitude and longitude. That notation would look like:
{x1, y1}
Here, x1 refers to the longitude of the place of residence where case 1 resided, and y1 to the latitude. The longitude and latitude of the place of residence provides a location that any GIS software, such as Vesta, can understand. It’s helpful to number the cases for record-keeping purposes. Since this is case 1, you might know that person’s age at diagnosis and other bits of information associated with case 1. We’ll discuss how to record these other attributes later on.
Now suppose you also know the date of diagnosis of case 1. That would be the When–the time when diagnosis occurred. The notation would then look like:
{x1, y1, t1}
Here, t1 is the date of diagnosis of case 1.
Suppose a researcher is running a study following what is known as a case-control design, in which both bladder cancer and controls are included. The controls have been chosen so that their age distribution and other characteristics known to be associated with bladder cancer are similar to that of the cases. This information can allow you to inspect the geographic distributions of the cases, compare that geographic distribution to that of the controls, and explore where they differ. In that case, the notation would be:
{a1, x1, y1, t1}
The term a1 has been added to the attribute for person 1. You’ll set this attribute as the case-control identifier for person 1 and assign it a value of 1 if the person is a case and 0 if that person is a control. Notice the new meaning of the subscript to indicate persons rather than cases, and the attribute a1 indicates person 1’s case-control status.
Now you know the What, Where, and When using mathematical notation, but what about the Why? The Why is where geospatial analysis comes into play; it’s used to describe the geographic patterns in the data and identify possible processes that gave rise to them. It’s the plausible explanation for the patterns seen.
#2. Maps
The example above considered only 1 attribute—the case-control identifier.
But what if you want to consider multiple attributes? That’s what is referred to as the “GIS layer cake”. 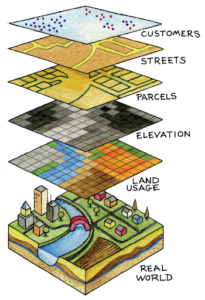
- At the bottom is the “Real World”, shown as geology, soil characteristics, hydrology, buildings, and so on.
- Floating above that are the GIS data layers, “Land Usage”, “Elevation”, “Parcels”, “Streets” and “Customers”, which are referred to as vector and rasters.
What matters is that every bit of information in these data layers is associated with a location. It then becomes possible to render the GIS data layers as maps by assigning colors to attribute values and plotting them on a computer screen, smartphone, or digital plotter.
The underlying idea of the layer cake is to graphically represent the GIS data as maps, using the attribute values and locations that are embedded in every piece of GIS data.
#3. Queries and Analysis
Queries and analysis are two related components of GIS.
Query
Once you have the GIS layer cake, what exactly can you do with it?
The obvious thing is to stick a knife in it. That’s the idea behind a spatial query—taking the attribute values of different data layers at a given location. Using the GIS layer cake example, you could query a customer, determine where they live, the real estate parcel that contains that residence, the elevation of the home, and the nearby land usage. The spatial query uses the multiple layers in a GIS to obtain a data profile at any given location.

Geospatial Analysis
Geospatial analysis is where higher-order questions come into play.
Let’s return to the case-control data example. Scrapie is a degenerative disease of the nervous system in sheep that is almost always fatal. Once infected, an animal is infected for its remaining life, and the impact on a herders flock can involve quarantine and eradication. In a study of scrapie disease in Norway, the locations of farms were recorded with a case-control attribute indicating whether or not there were cases of a scrapie variant, Nor98, in the flock.
A quick inspection of the map finds an apparent cluster of infected farms in Northern Norway and another in Middle Norway. Such a pattern might indicate an infectious etiology with the infection spreading from one nearby farm to another. This suggests a series of questions:
- Is the apparent clustering of infected farms real or best explained by chance?
- If it can’t be explained by chance, how is the infection transmitted from one farm to another?
These can be answered using geostatistics and other methods in our Vesta and SpaceStat products.
Figure: Geographic distribution of the case and control flocks in a case-control study of scrapie Nor98 in 136 sheep flocks in Norway. The country is divided into four different regions used in the analysis. Sheep flocks within the striped area were excluded from the study. Source: Martha Jakobsen Ulvund
#4. Apps
You likely encounter GIS mapping applications every day on your smartphone.
Weather Underground is a great example—the app allows you to inspect radar maps animated through time to see how precipitation is occurring across North America.
Do you use navigation apps to find your way? That’s GIS-driven, using data describing your location in real-time, on the road network on which you are driving. Real-time data from other cars on the road is used to determine oncoming traffic conditions.
As you’re driving you might ask your companion to look for a gas station, and they might conduct a search and type in “Gas stations nearby”. That’s a spatial query, and it can help you get back home with fuel to spare.
GIS is working all around us
By now, you have some sense of how the What, Where, When, Why of GIS can go to work for you. From the data to case-control representation to the GIS layer cake, geospatial analysis answers the most complex questions.
Put all of this information into action with one of BioMedware’s products for the visualization, exploratory analysis, and modeling of time-dynamic geospatial data for the health and environmental sciences. View our products.