In the world of spatial analysis, where data points are scattered across a landscape, a fundamental question arises: how can we estimate the value at a location we haven’t sampled?
For most geoscientists, the answer is kriging.
Far more than a simple interpolation method, kriging is the theoretical and practical cornerstone of geostatistics, earning its nickname as the field’s tireless “workhorse.”
Kriging’s Core Idea: Best Linear Unbiased Estimation
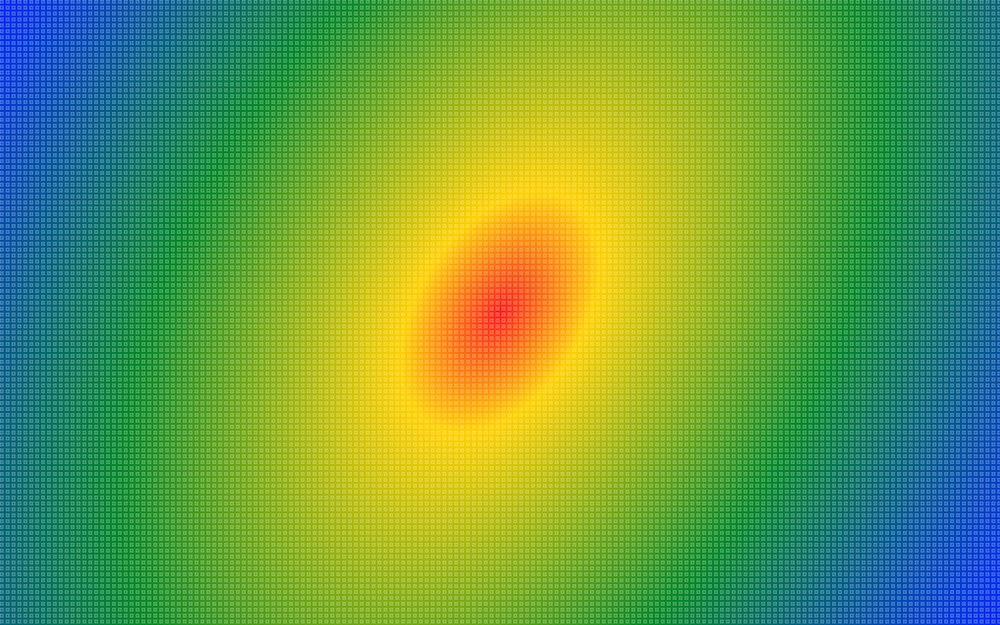
Kriging is a family of linear estimators. The goal of kriging is to predict the value of a variable (like ore grade, pollutant concentration, or elevation) at an unsampled location as the weighted average of nearby observations.
However, what sets kriging apart is its rigorous statistical foundation. It aims to be the Best Linear Unbiased Estimator (BLUE):
- Linear: The estimate is a weighted average of the surrounding known data points.
- Unbiased: On average, the estimated value is equal to the true value. The method does not systematically over- or under-predict.
- Best: It minimizes the estimation variance, meaning it provides the most precise (i.e., least uncertain) estimate possible given the available data.
Kriging is also instrumental to perform what is known as change of spatial support—where the value of a variable is estimated at a spatial scale that differs from the sampling or observation scale.
Using the terminology introduced by Gotway and Long (2002), kriging allows one to tackle three different types of change of support: upscaling (e.g., aggregating point data into an area), downscaling (e.g., disaggregating an area’s data into points), and side-scaling (e.g., two sets of overlapping areas, like going from ZIP codes to census tracts).
The Secret Sauce: The Variogram
The “magic” of kriging lies in how it determines the weights for the weighted average. Unlike simpler methods like inverse distance weighting (IDW), which assign weights based purely on geometric distance, kriging uses the semivariogram (or simply variogram).
The variogram is a crucial model that quantifies the spatial autocorrelation of the data. It describes how the similarity (or dissimilarity) between data points changes with distance, mathematically capturing the “spatial fingerprint” of the phenomenon being studied. This model then dictates the optimal weights for the estimation, giving more influence to nearby, highly correlated points and less to distant, uncorrelated ones.
Another major benefit of kriging over simpler methods (IDW) is its ability to take into account the data geometry (i.e., distances among data), in addition to the distance between data and the location being estimated. That property entails that geographically clustered observations receive less weight since they are viewed as redundant.
5 Types of Kriging To Consider
The versatility of kriging is why it’s a workhorse. It has been adapted to handle a wide variety of spatial scenarios, all available in Vesta:
- Ordinary Kriging: The most common type. It assumes the local mean is unknown but constant within the local search neighborhood. This is a robust and widely applicable default.
- Simple Kriging: Assumes the global mean of the entire study area is known and constant. It’s less common in practice as this assumption is often too restrictive.
- Compositional Kriging: Used when data are compositional—parts of a whole that are constrained to sum to a constant. This type of kriging involves transforming the data into logratios and back-transforming the kriging estimates to ensure that the constant sum constraint is satisfied by these estimates.
- Indicator Kriging: A non-linear variant used for estimating the probability of exceeding a certain threshold. It’s invaluable for risk assessment, such as mapping the probability of contaminant levels exceeding a regulatory limit, or for estimating the probability of presence/absence of a class for a categorical variable.
- Co-Kriging: An advanced technique that incorporates a secondary, more densely sampled variable that is spatially correlated with the primary variable of interest. For example, using easy-to-measure electrical conductivity to improve the estimation of difficult-to-measure soil moisture. Vesta allows the incorporation of up to two secondary variables!
Beyond the Estimate: Quantifying Uncertainty
The most powerful feature of kriging, and a key reason for its dominance, is that it doesn’t just provide a map of estimates. For every location it predicts, it also provides a kriging variance or standard error. This produces an accompanying map of uncertainty, showing where the predictions are reliable and where they are less certain (typically in areas far from any observations). This ability to quantify confidence is critical for making informed decisions in resource management, environmental remediation, and engineering.
In conclusion, kriging is the workhorse of geostatistics because it is statistically optimal, theoretically grounded, and remarkably versatile. By transforming raw spatial data into a model of spatial structure via the variogram, it provides not only the best possible estimate but also a crucial measure of its own reliability, making it an indispensable tool for anyone working with spatial data.
And for those of us who aren’t geostatisticians? Vesta’s automated geospatial interpolation, including data transform and automated variogram computation and modeling, will do it all for you. Try Vesta for free here!
Sources: