
When working with real-world data, mistakes can happen. Sensors break or equipment malfunctions, and then what?
This is where the concept of missing data, also known as missing values, comes into play.
What is Missing Data?
Missing data occur when you don’t have observations or measurements for certain variables at specific locations and times due to equipment problems, incomplete data entries, confidentiality concerns or lost files. This can cause issues such as sampling bias, which means that the results are not fully accurate because the data came from an unrepresentative sample.
In Excel, you may have data entries that are lost or missing. So how do you handle that? You need to have a mechanism in the software to record missing data and to identify them as missing. When it’s read in the software, you have a special way to handle missing data and a symbol to show that it’s missing data. Remember: it’s missing, not absent.
Two Forms of Missing Data
Statisticians recognize 2 different forms of missing data: Missing completely at random (MCAR) and Missing at random (MAR).
MCAR occurs when the missing data are randomly distributed across all observations. Statistically, this means the potential for a biased sample is reduced, since there is no relationship between the data, time or location of a data point and whether it is missing
In MAR, the missing data are not randomly distributed across observations but are instead distributed within one or more subsamples. MAR is a very common form of missing data in some fields, such as surveys, since people in certain demographics may be less likely to complete a survey than others. When working with space-time data, it sometimes happens that certain areas, or times, were not sampled as intensively or as systematically as others. When samples within certain areas or times are missing, this can result in MAR as well. This means the data can be biased, so that population parameters, like the mean or variance, are not estimated correctly.
From a statistical perspective, MCAR is less likely to lead to estimation bias (for example, under estimating the overall average or mean), while MAR can introduce bias, a systematic over- or under-estimation of statistical properties of the data.
Consider some examples. In the environmental sciences, field conditions may preclude collecting data from certain locations or times. For example, when sampling soils a heavy rain event may make field sampling impossible.
Population subgroups are another great example of how missing data can impact a study, especially with minority populations. In the Upper Peninsula of Michigan, over 90% of the population is caucasian, so a study about the prevalence of prostate cancer among black males is hampered by the lack of individuals. It’s there, but it’s not counted. It’s missing.
Cancer registries are another example. To ensure the confidentiality and stability of rate estimates, data are often suppressed if fewer than 16 records were reported in a specific area-sex-race category. These are missing data, not absent.
For spatial and space-time applications, such as those in GIS technologies, missing data introduce even more issues. These range from data input (how do we read something that isn’t there?), representation in tables and maps, and handling in geospatial analysis algorithms. What to do?
Vesta and Missing Data
Why is this so important? Because people want to fill in the gaps and missing data can bias your results. Also, you don’t want to have to discard an observation because some of the variables were not recorded at that location
Our newest innovation Vesta is now the only GIS system that can handle missing data. Many statistical analysis packages of course handle missing data, but other GIS systems don’t. That’s because of the additional issues that must be addressed in GIS software in order to deal with missing data, including data import, visualization and spatial analysis algorithms. Worse, some GIS handle a missing data as a zero, that is, they treat the missing data as though it has the value of 0.
With Vesta, users can now import their data, visualize it, and understand how to use that data in an analysis. Vesta handles missing data in visualizations and calculations.
In the maps, Vesta will display an object that is missing for a variable with a custom appearance, often gray by default. Vesta will describe the variable value as missing or abbreviate it with ‘-’ in tables.
The easiest way to specify missing data is upon importing a data file. On the main dialog to import a file, check the box under Data Options to select that the Dataset contains missing data. You can then choose whether the missing data is represented by no data or a specific value.
No data includes cases such as when a spreadsheet cell is empty for a missing value. Sometimes files encode missing data with a specific value, for example -9999. If you choose to specify missing data upon import, it must be represented consistently across all variables within that file.
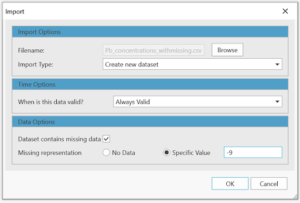
Importing in Vesta a csv file with missing values coded as “-9”.
In calculations, charts, and statistics any missing observation will be excluded from the analysis. These locations will not be included in sample sizes and totals used in calculations. Analyses, results, and descriptive statistics will appear as if these locations did not exist. Note that this applies only to the time interval(s) when the data is missing and the locations will be used at other time intervals when they are not missing.

Using Vesta to visualize rates of late-stage prostate cancer diagnosed for Hispanic males in Florida counties. For confidentiality reasons most rates were missing in 1981 and are automatically grayed out in the map.
Download Vesta 1.2
Being able to handle missing data is an integral part of good data analysis practice. Handling missing data is included in Vesta version 1.2 and later. To give it a try download Vesta.