Navigating Vesta
When Vesta is opened, the user will see the main screen.
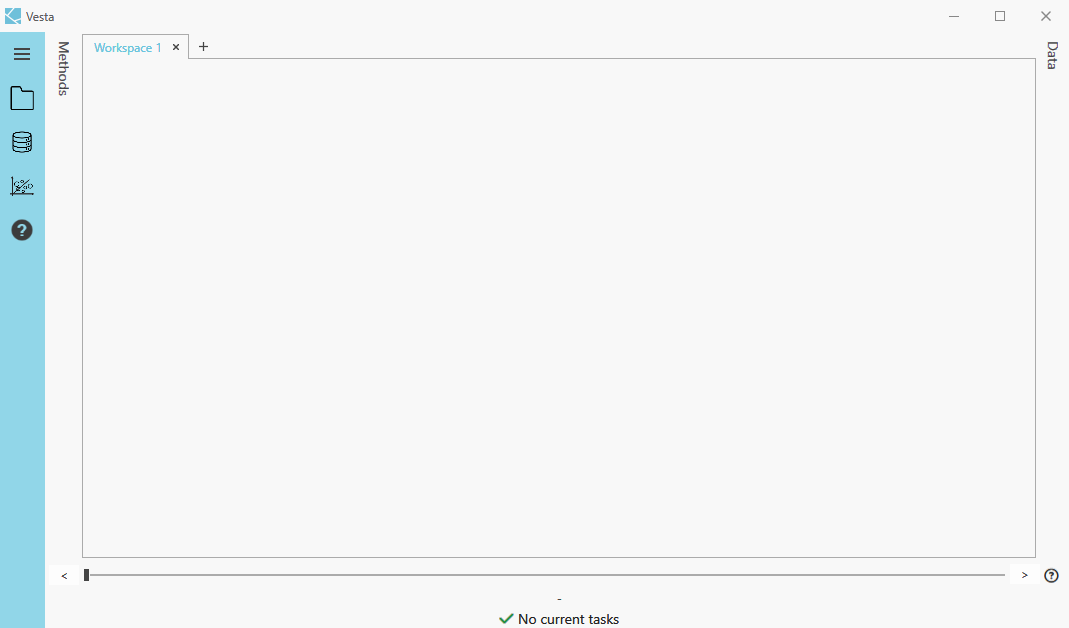
Workspace
The workspace area is in the middle. New workspaces can be added by selecting the "+" symbol next to the workspace tab, and any workspace tab can be renamed by double-clicking on it and then hitting "enter" on the keyboard. Any visualizations or reports created are automatically displayed in the workspace area (up to four visualizations will display in one workspace at a time.)
Note that the timeslider is no longer visible at all times. It is displayed at the top of the workspace for time-enabled data, when loaded into Vesta.
Main Menu
The main menu panel is to the left. The menu is now fixed width and has six buttons: File, Data, Visualize, Analyze, Help, and Settings at the bottom left corner.
Help Button
Help links this software documentation material and the support request form. Feel free to consult these at any time, and reach out to our team with any questions.
User Settings Button
The Settings button lets users set their preferred applications settings when using Vesta. Once set by the user, Vesta will remember the preferences across new projects and even after Vesta is relaunched. Users can change these settings at any time to update preferences. Preferences are reset when Vesta updates.
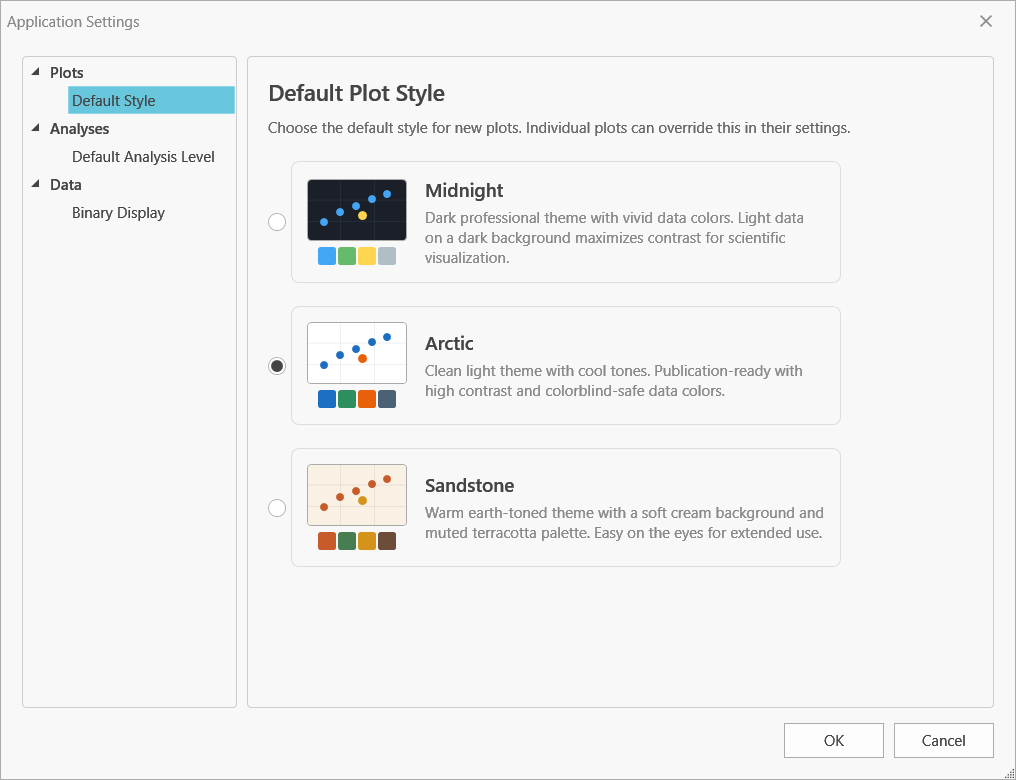
In the first screen, user can set default plot style.
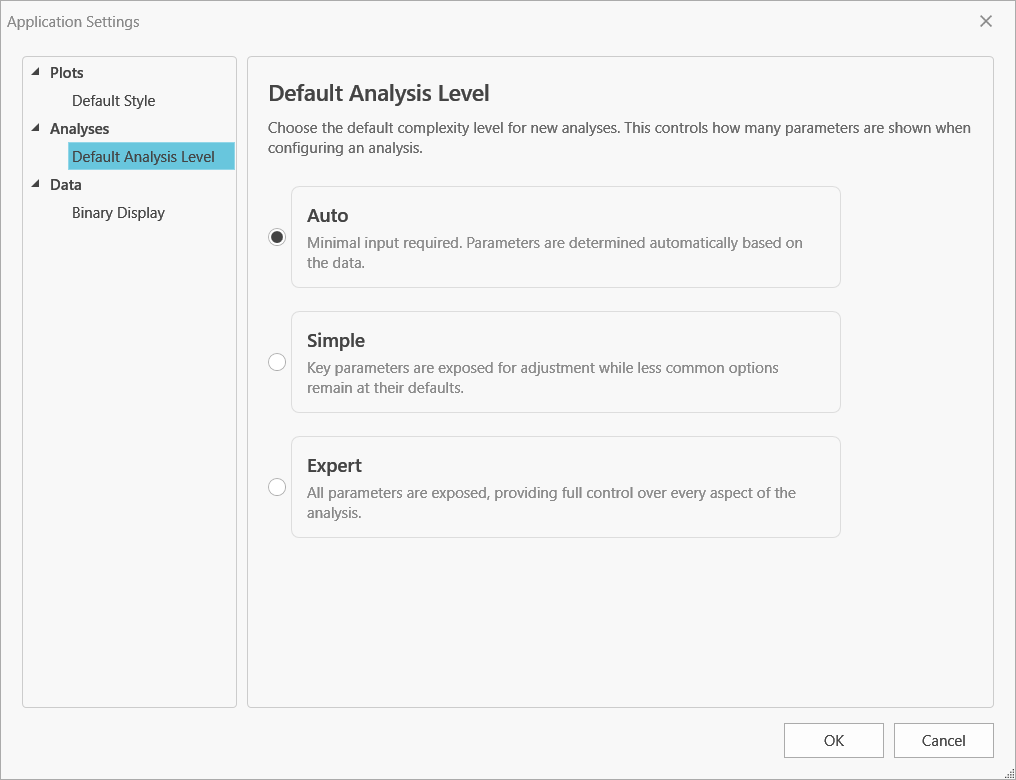
In the second screen, user can set default complexity level for new analyses. This controls how many parameters are shown when configuring an analysis.
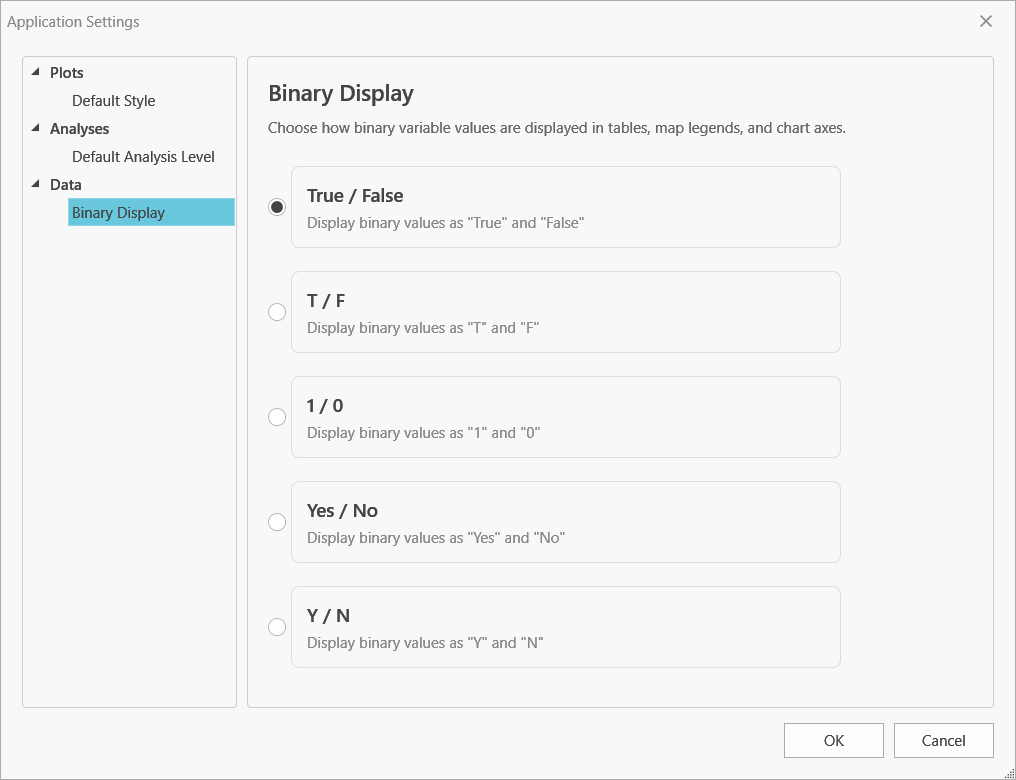
In the last screen, user can set how binary variables are displayed in tables, map legends, and chart axes.
Vesta Advisor
To learn more about the Vesta Advisor, visit the dedicated Advisor page.
Data Panel
The Data panel to the right is automatically hidden by the Advisor Panel when Vesta launches. The user can toggle between the Advisor panel and the Data Panel.