Creating a Map
The map view is the ultimate Vesta experience, where data can be seen in space with one simple view.
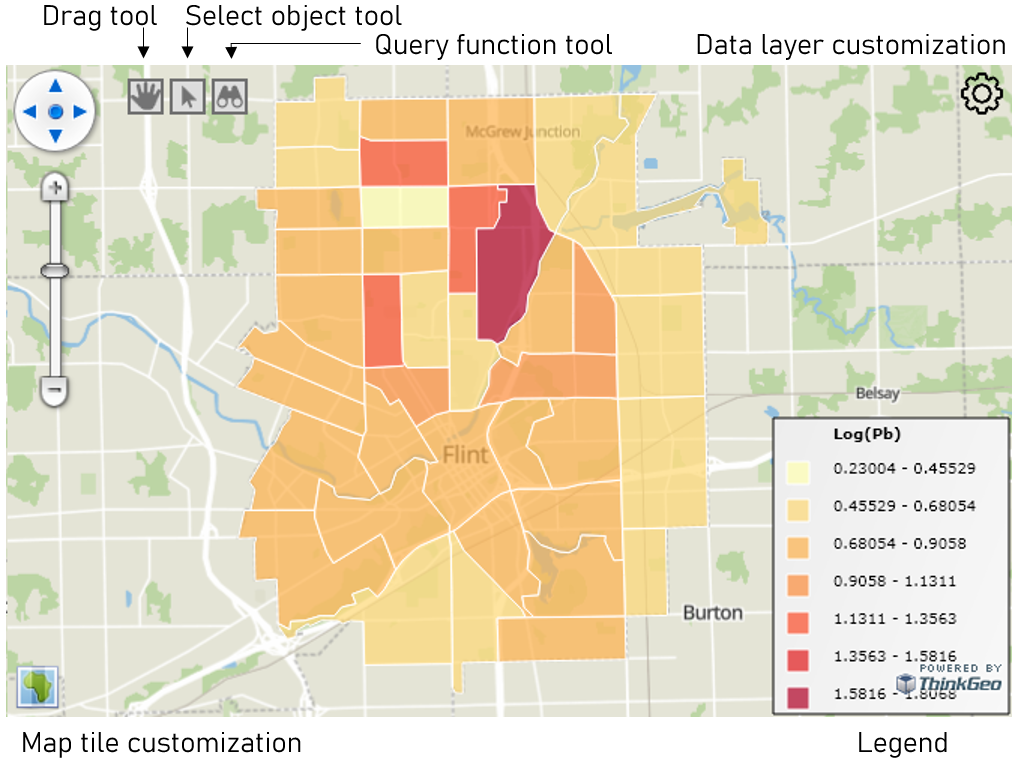
Use scrolling to zoom in or out of the map. To zoom on an area of interest on the map, use the shift key and drag your cursor to select the desired areas.
When running Vesta without internet connection, the map tiles (the geographic background) will not display when viewing a map.
Note that it is important to manually save any time dependent information of the map when exporting the image file.
Process Steps
- Open the Visualize hub from the main rail (see Navigating Vesta).
- Choose a path:
- Guided — pick an option that includes a map, such as "Explore one variable," or
- Manual — pick "I know exactly what I want," choose a layout, and add a Map view from the catalog.
- In the pane's variable dropdown, search for and select the variable you want to display — this one searchable list covers variables, datasets, and results together.
- Select Create workspace to build a new workspace, or Adjust current to add the map to the workspace you already have open.
Multiple Map Layers
If a variable from a different dataset is added, it creates a new layer on that map and the user can move layers up or down. The legend corresponds to the top-most layer and the individual layers' colors can be changed from the map layer settings.
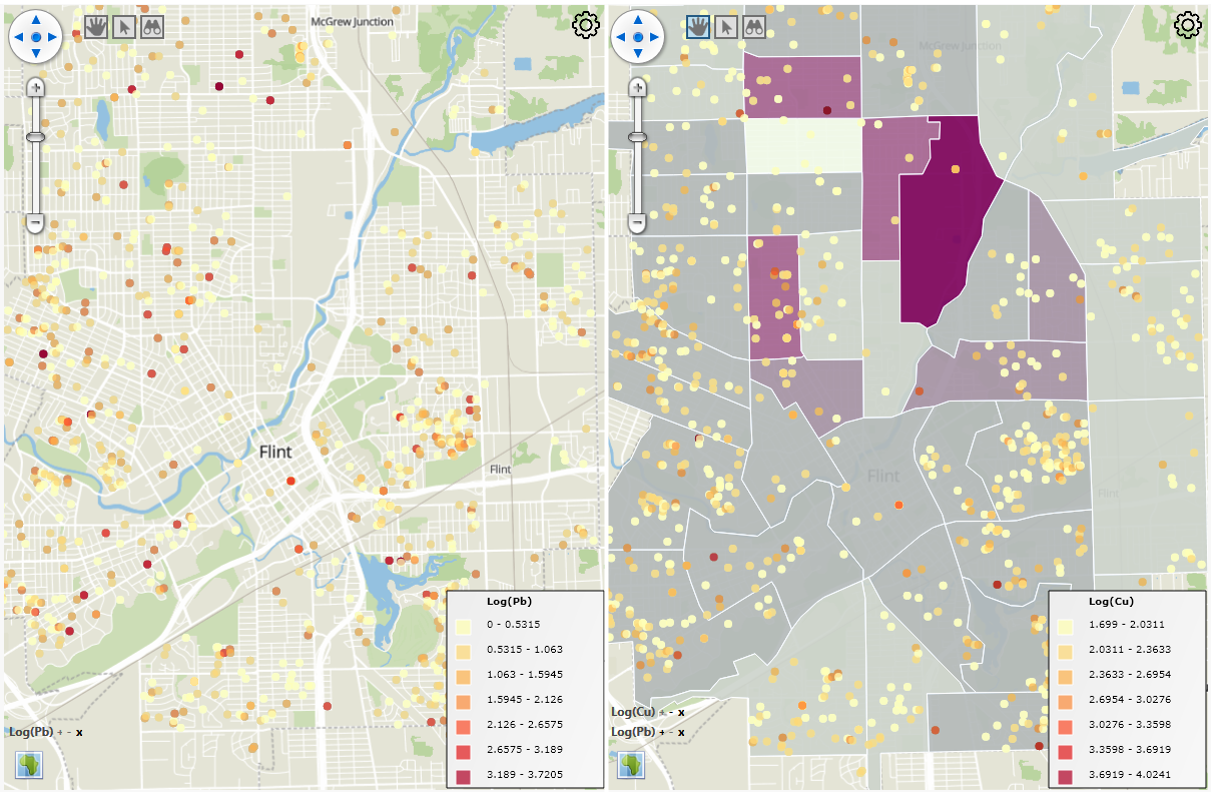
The side by side comparison of two maps above shows the point data from the left overlaying a polygon layer, representative in this case of Flint's census tracts.
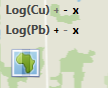
At the bottom left corner of each map rendition, the layer order can be changed by clicking the '+' symbol to bring a layer to the top, or to the bottom by clicking the '-' symbol. Clicking the 'x' symbol will erase that layer from the map.
Query Function
The query function in the map visualization creates a table with all of the data pertaining to a selection geographic location.
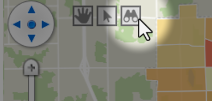
Click on the query tool, and then select a location of interest on the map. A table of information on the selected map layer will display.
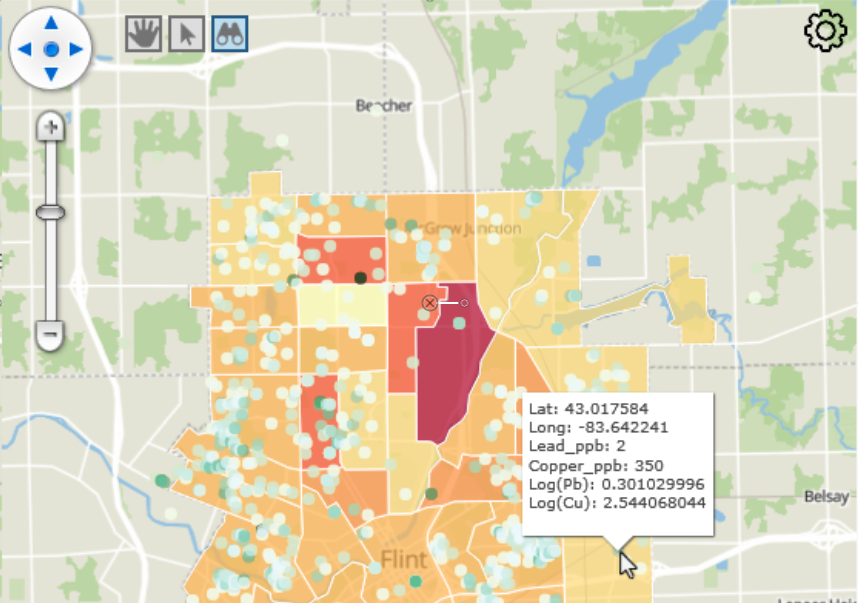
Map Customization
Vesta offers a host of customization options for maps.
- Selecting the upper right hand setting wheel opens Map Settings — a single panel covering everything below.
- The map view can be explored by using the drag tool (hand icon), and selections on the map area are made by clicking on the cursor icon.
- Individual objects can be selected using the query tool (binoculars icon) to get a snapshot data summary for that object.
- Tutorial 1 illustrates how to use map customization.
Map Settings
Map Settings is one panel that floats over the live map. Every change you make in it — reordering a layer, picking a basemap, editing a style — redraws the map immediately; there's no OK or Cancel, only Reset all (to undo everything since opening the panel) and Done.
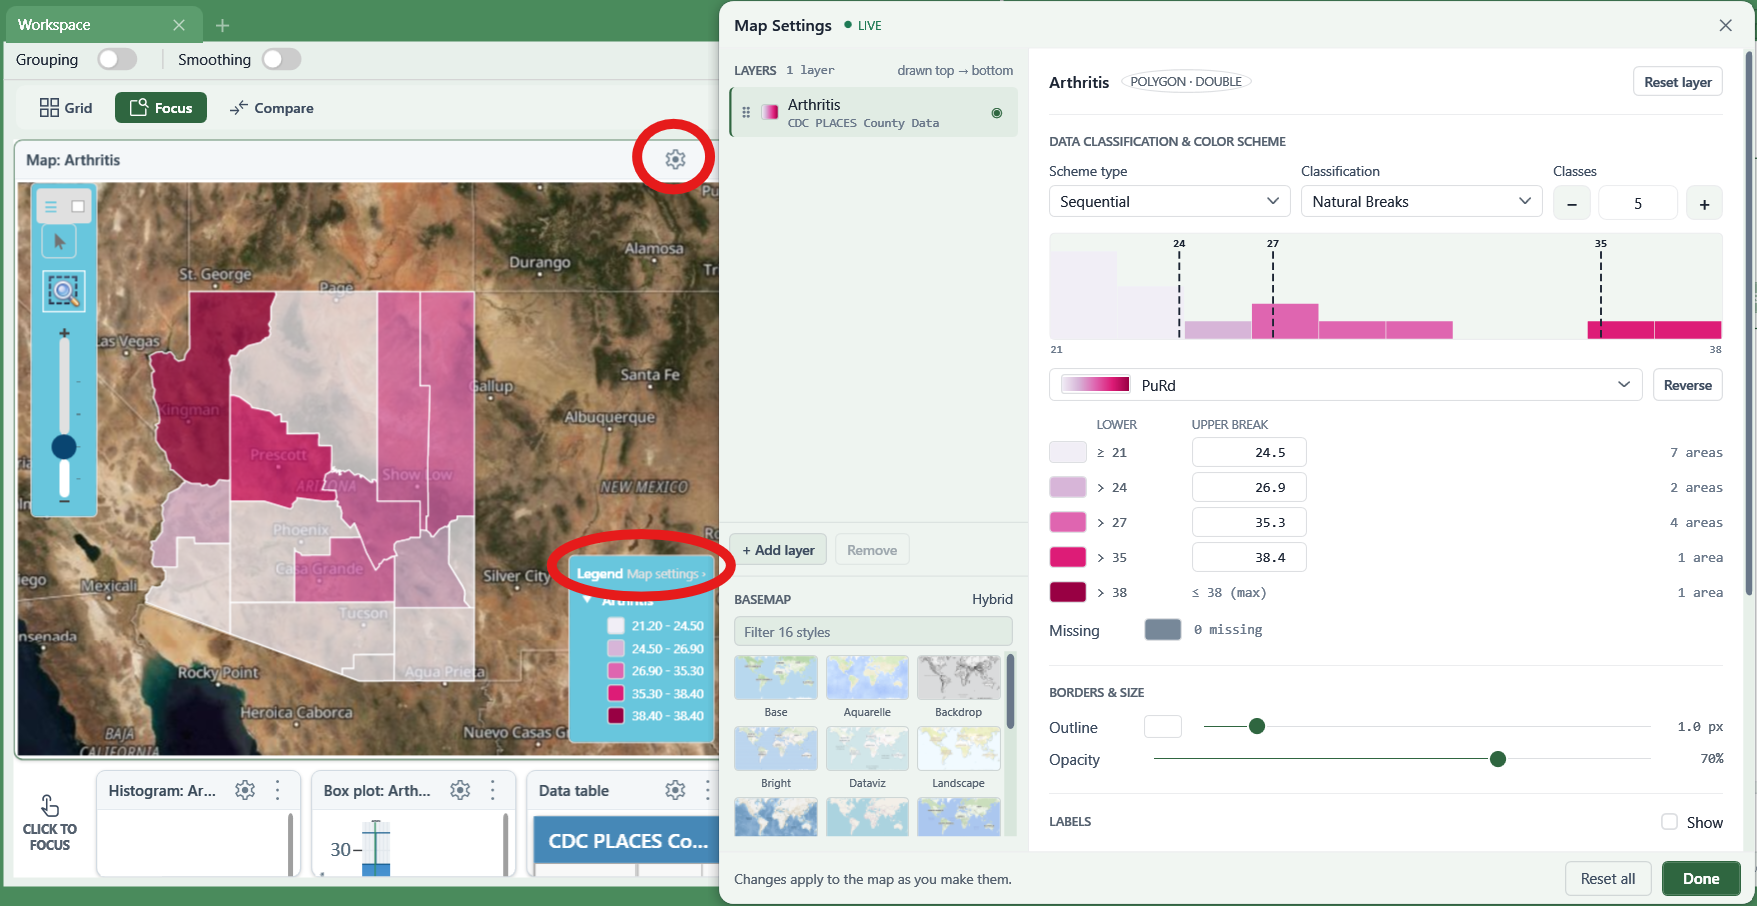
The panel has three parts:
- Layer rail — every layer on the map, in draw order. Drag to reorder, and use the rail's controls to add a layer, rename one, show or hide it, or remove it.
- Basemap picker — a searchable list of background tile styles for the map.
- Style editor — edits the currently selected layer. Its content depends on the layer's kind:
- Numeric and Raster layers — data classification and color scheme: classification method, number of classes, a scrollable palette of color ramps (each class individually editable, with a Reverse option), and a legend preview. Raster layers additionally offer a Classified / Continuous color-ramp toggle.
- Categorical and Binary polygon layers — a color for each category, plus fill patterns so categories remain distinguishable without relying on color alone.
- Point (categorical) layers — a symbol and color for each category.
- Simple fill layers — a single fill color, independent of any variable.
Whatever kind of layer you're styling, a Save style to variable control writes the style back onto the variable itself, so it's reused automatically the next time that variable is mapped.
Movement Trails
A moving-point layer (see Importing Data for how these are created) has its own style editor section for its trail:
- Draw trails — turns the trail on or off.
- History — show the object's entire recorded history, or only its last few positions.
- Line options — fade older segments of the trail, mark each recorded position along it, and optionally restrict trails to selected objects only.
- Color — match each trail to its object's symbol color, or use a single color for all trails.
Note that a layer's style belongs to the variable itself, not just to this one map. Saving a style updates it everywhere the variable is displayed, and the choice is saved with the project.