Exporting Visualizations
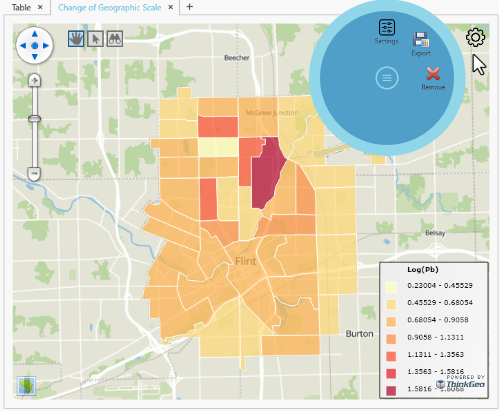
When creating visualizations in the workspace area, each visualization has a gear icon in the upper right corner. When opened, the export icon can be clicked to save a copy of the generated visualization.
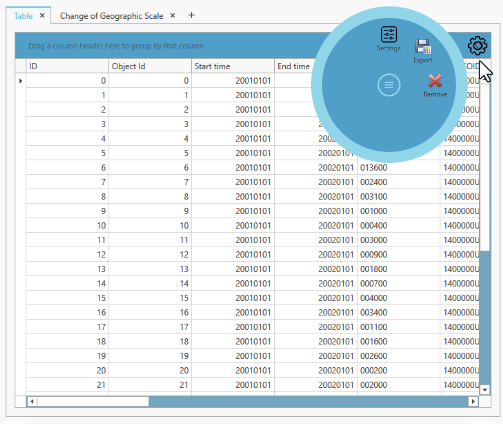
Every visualization can be exported as an image (PNG or JPEG). For panel types whose underlying data can be pulled out directly — including the correlation matrix, ROC curve, contingency table, rose diagram, seasonal subseries, partial dependence, variable importance, sensitivity heatmap, correlogram, decomposition plot, and profile plot — a CSV option is also offered, exporting the actual bin counts, series values, matrix cells, thresholds, or rates behind the picture rather than the picture itself.
(The screenshots above may not reflect the current export dialog's file-type options.)
Note that for time-dependent data, a single visualization, corresponding to the time indicated by the time slider, is exported. Please make note of the time slice used when saving visualizations for future reference.